Portfolio Item Burn Up Dashboard
The Portfolio Item Burn Up dashboard provides visibility into the advancement of individual portfolio items. This dashboard displays a forecasted end date for the portfolio item based on a user-selected linear forecast algorithm. This forecast leverages historical progress data to estimate the anticipated completion time for the remaining work.
The Last refresh date on this dashboard refers to the date and time when the data displayed on the dashboard was last updated or refreshed from the underlying data sources. You can know the data's freshness and make informed decisions based on the most recent information.
This dashboard is built using the portfolio_item_burn_up dataset.
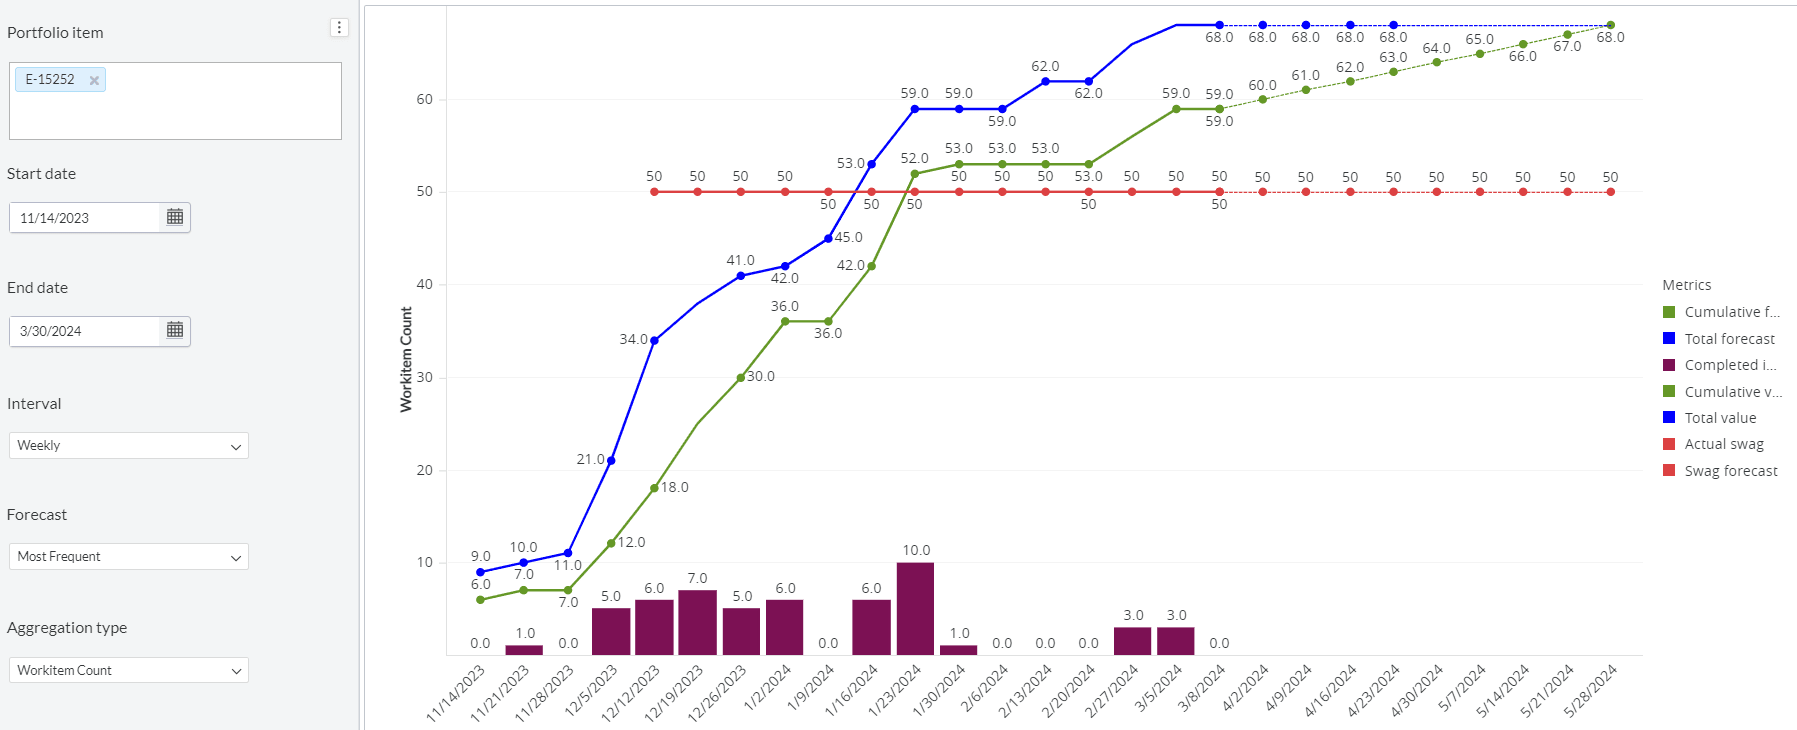
Here is an example portfolio item burn up panel.

You can filter and view the required data using the following filters:
- Portfolio item: Displays data of a selected portfolio item and all child portfolio items that belong to the portfolio item.
- Start date: Displays data of portfolio item in the selected forecast start date.
- End date: Displays data of portfolio item in the selected forecast end date.
- Interval: Displays data of portfolio item in any of the following intervals: daily, weekly, and monthly.
- Forecast: Displays data of portfolio item in any of the following forecast algorithms: average, optimistic, pessimistic, most frequent, and none.
- Aggregation type: Displays data of portfolio item in any of the following aggregation types: work item count and total estimate.
Forecast is a single possible end date using linear forecasting based on the following historical value:
- None: Do not forecast an end date.
- Average: Use the average of all visible slope values.
- Optimistic: Use the steepest visible slope value.
- Pessimistic: Use the lowest, non-zero, visible slope value.
- Most frequent: Use the visible non-zero slope value that occurs most often. If no slope value occurs more frequently than any other, use the average.
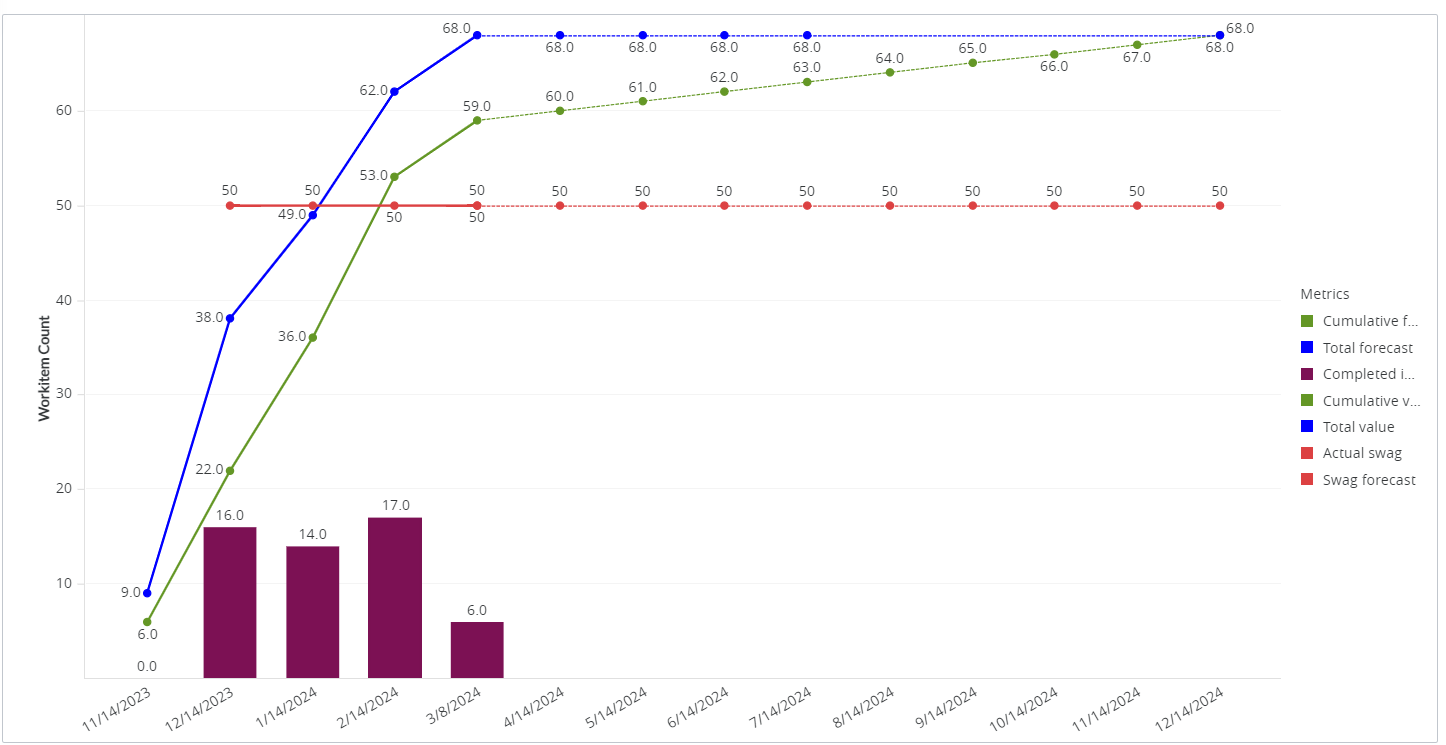
You can use these filters to refine the displayed data. For example, you can choose an interval from the Interval filter to view the corresponding dashboard. Here is an example interval-filtered panel.

Portfolio Item Burn Up
Displays the progress of individual portfolio items over time. You can use the Aggregation type filter to switch between viewing the dashboard based on the total estimate or work item count. Each bar on the panel corresponds to the completed story points or completed work item count on a particular calendar date. The x-axis represents the calendar date, and the y-axis represents the work item count or total estimate, depending on the selected aggregation type. You can hover the cursor over the data points to see the metric story points and snapshot date. This panel has the following trend lines:
- Total Value: The solid blue line represents the total estimate value, or the total backlog item count, for the backlog items associated with the selected portfolio item and all child portfolio items.
- Cumulative Value: The solid green line represents the total closed estimate value, or the total closed backlog item count, for the backlog items associated with the selected portfolio item and all child portfolio items.
- Actual swag: The dark red line represents the completed swag value for the selected portfolio item.
- Swag forecast: The Red dashed line represents the forecasted swag value for the selected portfolio item. This value does not include the swag value of all child portfolio items.
- Total forecast: The blue dashed line represents the forecasted total estimate or backlog item count value.
- Cumulative forecast: The green dashed line represents the forecasted total closed estimate or closed backlog item count value.
- Completed in this period: The dark red bar represents the completed work item count or total estimate in the given period.
Components used in this dashboard
The following components of the dataset are used in this dashboard:
Attributes
| Attribute Name | Description |
|---|---|
| Snapshot date | Date when the data presented on the dashboard is captured or recorded |
Metrics
| Metric Name | Description |
|---|---|
| Actual swag | Swag value of the selected portfolio item |
| Completed in this period | Number of total estimates or work item counts that are completed |
| Cumulative forecast | Number of forecasted total closed estimates or work item count |
| Cumulative value | Total closed estimate or work item count in the selected portfolio item |
| Swag forecast | Forecasted swag value for the selected portfolio item |
| Total forecast | Forecasted total estimate or work item count |
| Total value | Total estimate or work item count in the selected portfolio item |