Work Item TreeMap Dashboard
The Work Item TreeMap dashboard provides insight into the distribution of work items, such as backlog items, defects, and test sets, across multiple dimensions simultaneously. This dashboard helps you in effective project management and decision-making, allowing you to quickly assess and respond to the status and priorities of your work items.
The Last refresh date on this dashboard refers to the date and time when the data displayed on the dashboard was last updated or refreshed from the underlying data sources. You can know the data's freshness and make informed decisions based on the most recent information.
This dashboard is built using the work_item_summary dataset.
Work Item TreeMap
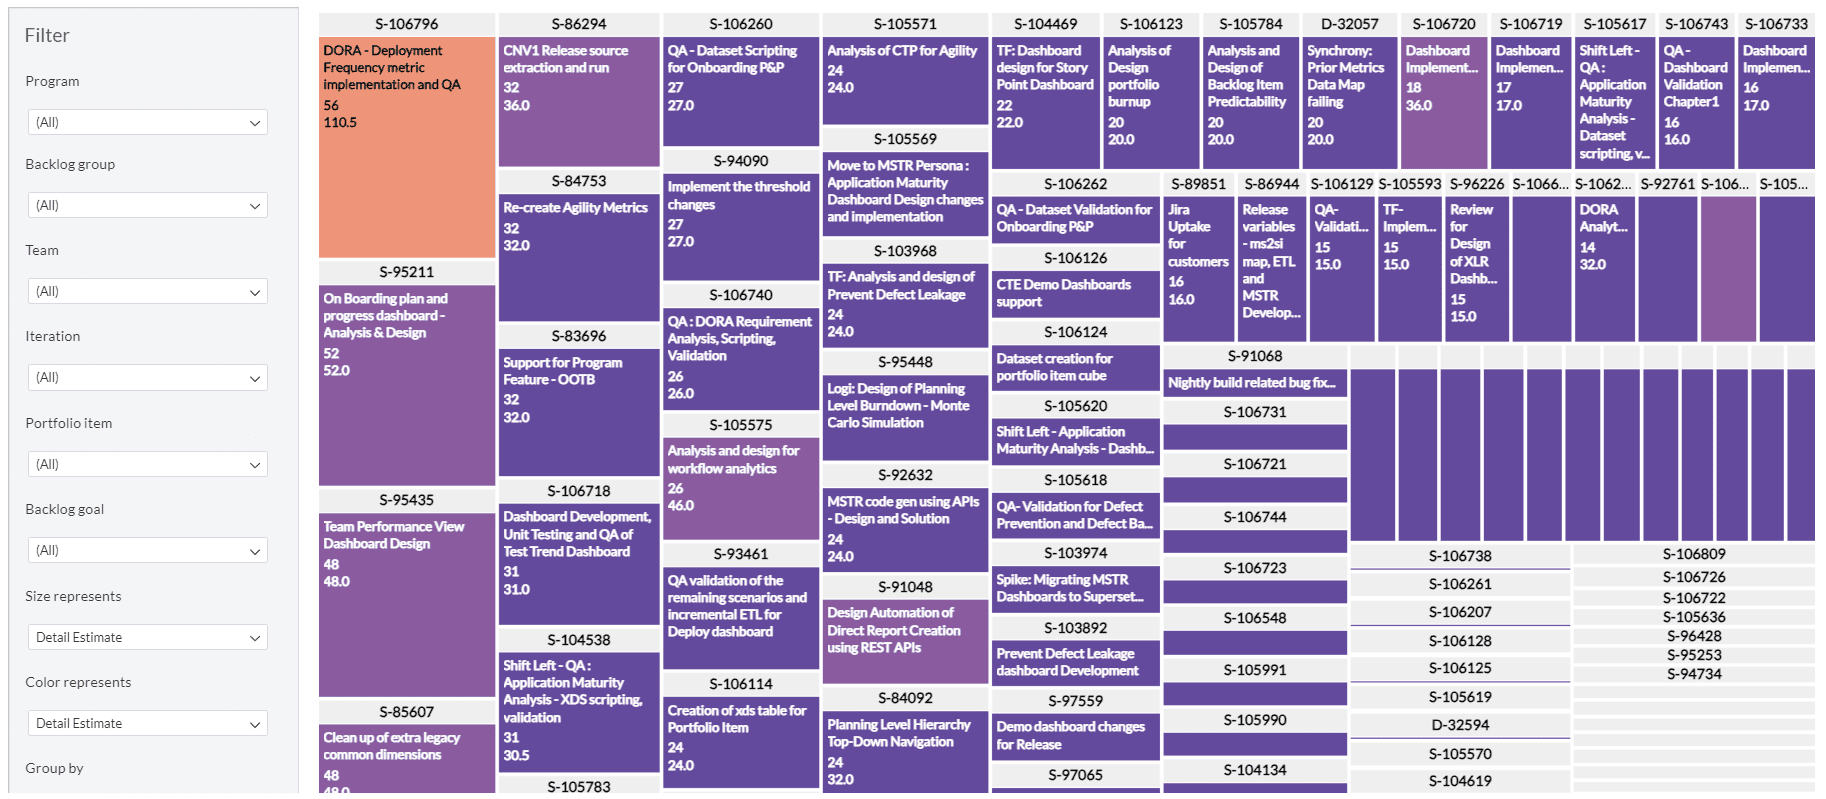
Displays a visual summary of your work items. Using the Group By filter, you can view the tree map on different dimensions like work item, iteration, work item type, backlog group, and portfolio item. Each tile represents a specific work item you need to work on. The size of these tiles is associated with the work involved. If a task is expected to take a lot of effort (high estimate points), the tile is bigger. If it's a smaller task, the tile is smaller. You can hover over the panel to see the dimension, estimate, status, priority, and detail estimate.

You can filter and view the required data using the following filters:
- Planning level: Displays data of work items in the selected planning level and all child planning levels that belong to the planning level.
- The following filters display filter values based on the filtered planning level.
- The following filters cascade each other.
- Program: Displays data of work items in the selected program.
- Backlog group: Displays data of work items in the selected backlog group and child backlog group that belongs to the backlog group.
- Team: Displays data of a specific group of cross-functional members.
- Iteration: Displays data of a specific planning period for an Agile team.
- Portfolio item: Displays data of work items in the selected portfolio item and all child portfolio items that belong to the portfolio item.
- Backlog goal: Displays data of work items in the selected backlog goal.
- Size represents: Displays data of work items in any of the following size represents: to do, estimate, and detail estimate.
- Color represents: Displays data of work items in any of the following color represents: estimate, status, priority, to do and detail estimate.
- Group by: Displays data of work items in any of the following dimensions: work item, iteration, work item type, backlog group, and portfolio item.
The Size represents filter defaults to To Do as the metric, while the Color represents filter defaults to Estimate. If you choose the same metric in both filters, the dashboard does not filter the appropriate data. It is recommended to use different metric combinations for effective data filtering.
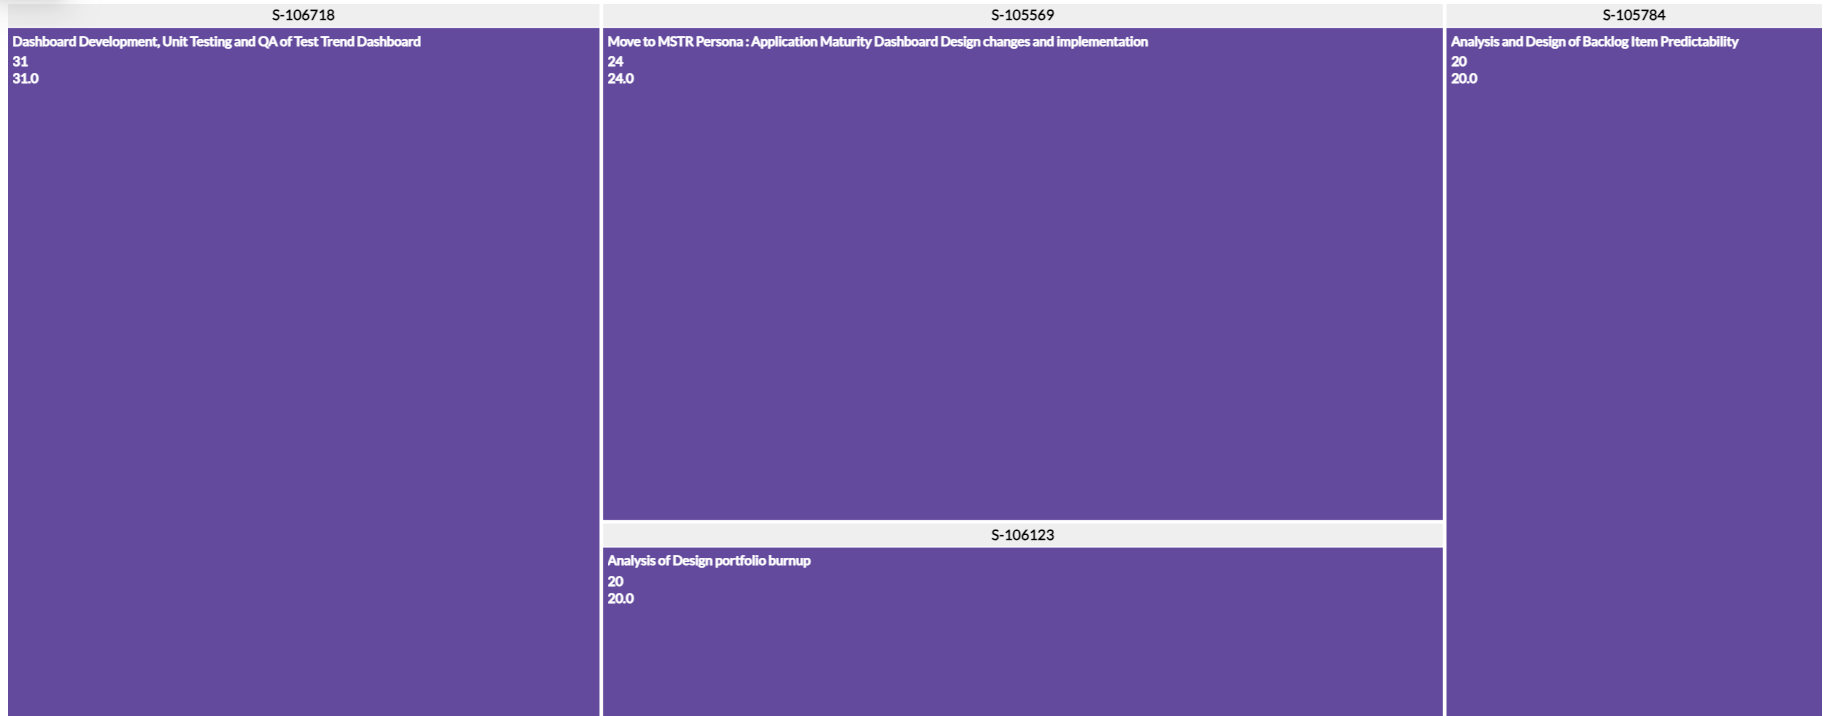
You can use these filters to refine the displayed data. For example, you can choose an iteration from the Iteration filter to view the corresponding work item tree map. Here is an example iteration-filtered panel.

Components of dataset
The following components of the dataset are used in this dashboard:
Attributes
| Attribute Name | Description |
|---|---|
| Backlog group | Hierarchical functional groupings of backlog work items |
| Work item summary | Summary of the work items |
| Work item | Unique identifier for the work item |
| Work item type | Type of the work item |
| Iteration | Iteration or Sprint to which the task is associated. |
| Portfolio item | Unique identifier for the portfolio item |
Metrics
| Metric Name | Description |
|---|---|
| Estimate | Summation of all estimate points of the backlog item in the iteration |
| Detail Estimate | Summation of all estimate points of the backlog item in the iteration |
| Priority | Priority of the work item |
| Status | Current status of the work item |
| To do | To do hours of a work item |