Backlog Item Responsiveness
The Backlog Item Responsiveness dashboard tracks and visualizes the average duration of backlog items in the "in progress" status over time. It provides insights into the responsiveness of the team or process in addressing and progressing with the backlog items. It also helps teams identify bottlenecks, improve workflow efficiency, and ensure timely delivery of backlog items.
The Last refresh date on this dashboard refers to the date and time when the data displayed on the dashboard was last updated or refreshed from the underlying data sources. You can know the data's freshness and make informed decisions based on the most recent information.
This dashboard is built using the backlog_item_responsiveness dataset.
Backlog Item Responsiveness
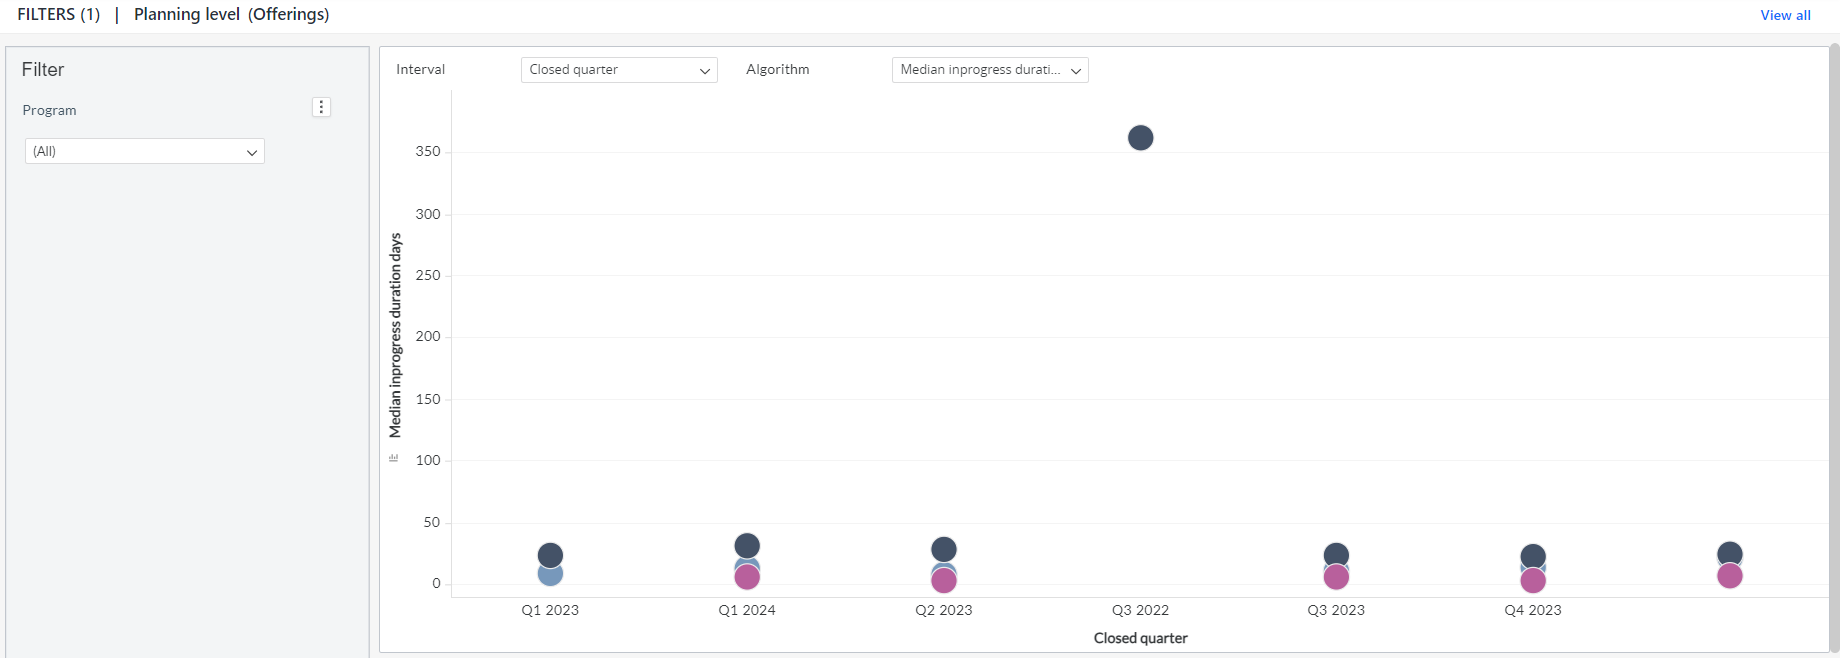
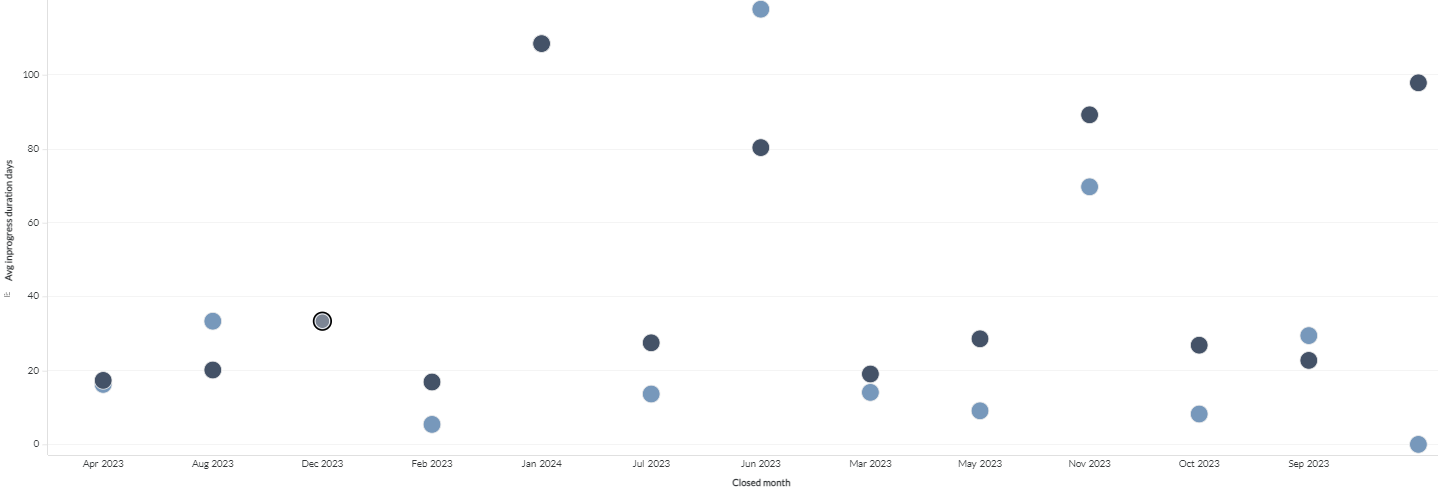
Displays the team's efficiency in completing work. The position of each dot on the scatter plot represents the average duration or time spent in the "in progress" status during the corresponding period. The x-axis represents the calendar month or quarter, and the y-axis represents the time that a backlog item is in the "in progress" status.
The Backlog Item Responsiveness has Median or Mode or Average Work item Days and Backlog Item Details grids. The Median or Mode or Average Work item Days displays details like the month or quarter on which the backlog item is closed or completed, the number of completed or closed defects, stories, and test sets, and the average or median or mode time that a backlog item is in the "in progress" status. The backlog item details displays details like the month or quarter on which the backlog item is closed or completed, work item ID, completed date, closed date, work item source URL, and in progress duration in days.
You can also click the icon against the work item number to launch the source system and view more backlog item details such as status, description, owner and team.

You can filter and view the required data using the following filters:
- Planning level: Displays data of backlog items in the selected planning level and all child planning levels that belong to the planning level.
The Planning level and Program filters cascade each other.
- Program: Displays data of backlog items in the selected program.
- Interval: Displays data of backlog items in the selected interval filter values like closed monthly, closed quarterly, completed monthly, and completed quarterly.
- Algorithm: Displays data of backlog items in the selected algorithm filter values like average, median, or mode in progress duration days.
You can use these filters to refine the displayed data. For example, you can choose a program from the Program filter to see the corresponding dashboard. Here is an example program-filtered panel.

Components of dataset
The following components of the dataset are used in this dashboard:
Attributes
| Attribute Name | Description |
|---|---|
| Closed month | Closed month of the backlog item |
| Closed quarter | Closed quarter of the backlog item |
| Completed month | Completed month of the backlog item |
| Completed quarter | Completed quarter of the backlog item |
| Closed date | Closed date of the backlog item |
| Completed date | Completed date of the backlog item |
| Type | Type of the backlog item |
| Work item type | Type of the backlog item |
| Work item ID | Unique identifier of the backlog item |
| Work item child backlog group that belongs | Source URL of the backlog item |
Metrics
| Metric Name | Description |
|---|---|
| Average in progress duration days | Average duration of backlog items in the in progress status. |
| Count | Count of backlog items in a program or planning level. |
| In progress duration (days) | Number of days a backlog item is in "in progress" status. |
| Median in progress duration days | Median time of backlog items in "in progress" status. |
| Mode in progress duration days | Mode of backlog items in "in progress" status. |