Backlog Item Predictability
The Backlog Item Predictability dashboard provides insights into the predictability of backlog items over time. This dashboard provides valuable insights into the consistency and reliability of backlog item delivery, helping teams make data-driven decisions to improve their delivery processes and meet customer expectations more effectively.
The Last refresh date on this dashboard refers to the date and time when the data displayed on the dashboard was last updated or refreshed from the underlying data sources. You can know the data's freshness and make informed decisions based on the most recent information.
This dashboard is built using the backlog_item_predictability dataset.
Backlog Item predictability
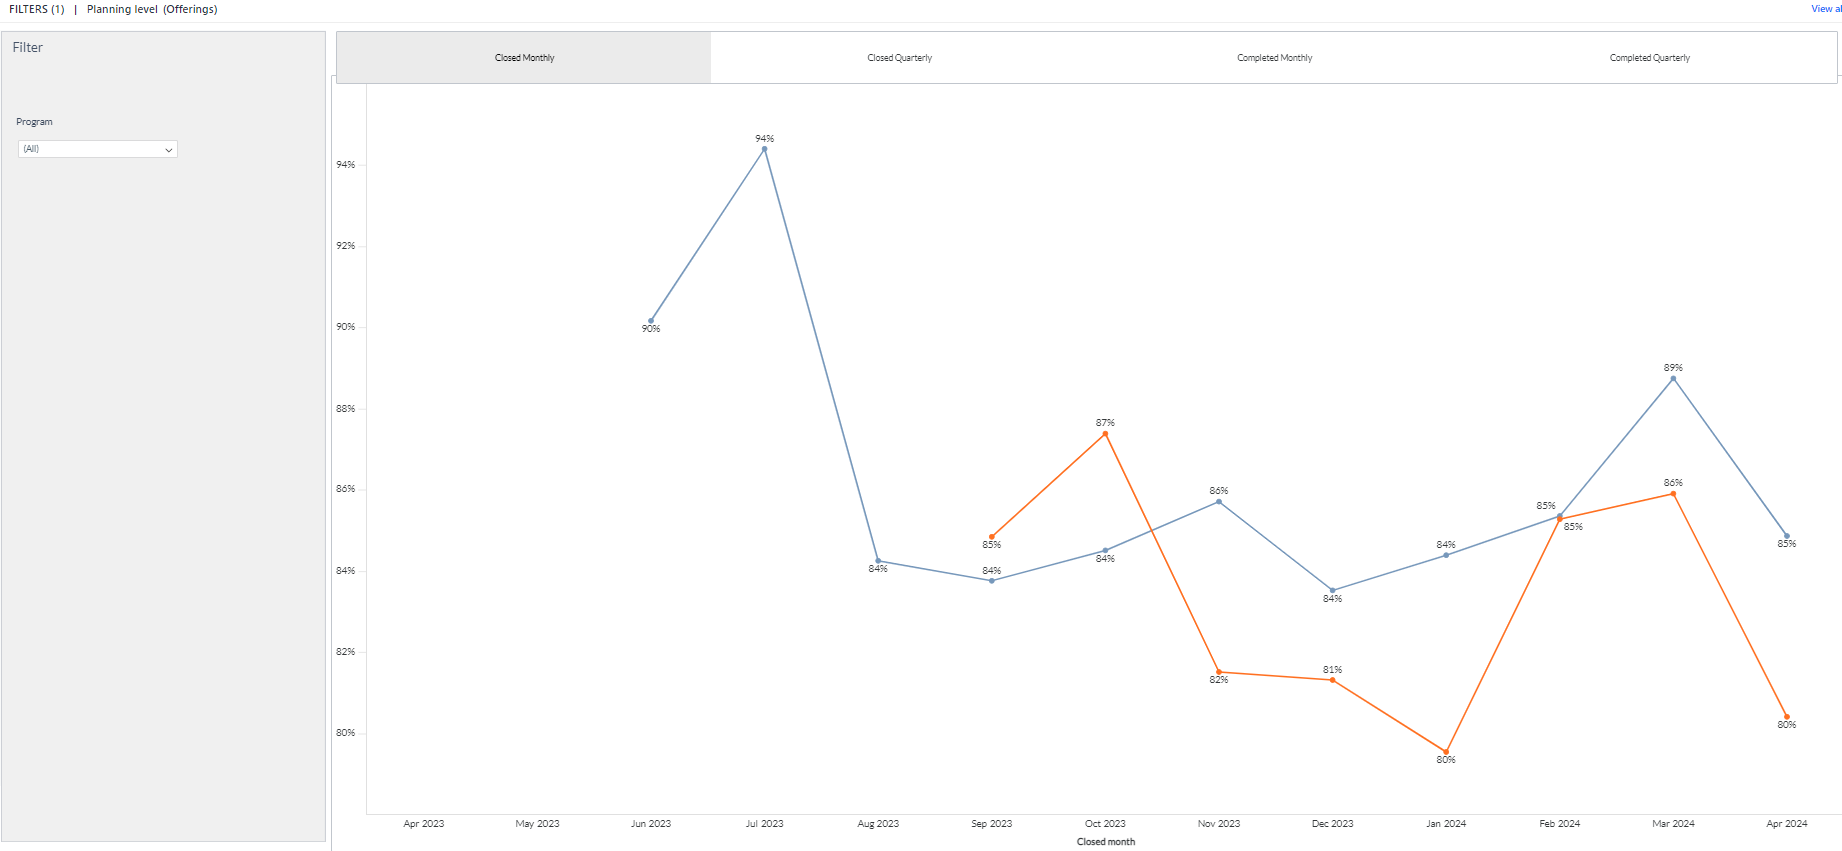
Includes visualizations and metrics that provide insights into the consistency of backlog item delivery across time. The panel has the following tabs:
- Closed Monthly: Presents data regarding the closure of backlog items every month, covering 13 months.
- Closed Quarterly: Presents data related to the closure of backlog items every quarter, spanning over 6 quarters.
- Completed Monthly: Presents data on the completion of backlog items every month, encompassing a timeline of 13 months.
- Completed Quarterly: Presents data on the completion of backlog items every quarter, spanning over 6 quarters.
The predictability score is calculated as either a 3-month running average or a 5-month running average, depending on the line. For example, using a 3-month interval:
- The data point in November reflects the average from September, October, and November.
- The data point in December reflects the average from October, November, and December.
- The data point in January reflects the average from November, December, and January.
The data considered for these averages is the backlog item throughput value for the respective periods. This value represents the number of completed or closed backlog items during the specified time frame. It does not include backlog items that are in progress.

You can filter and view the required data using the following filters:
- Planning level: Displays data of work items in the selected planning level and all child planning levels that belong to the planning level.
- Program: Displays data of work items in the selected program.
- The Program filter displays filter values based on the filtered planning level.
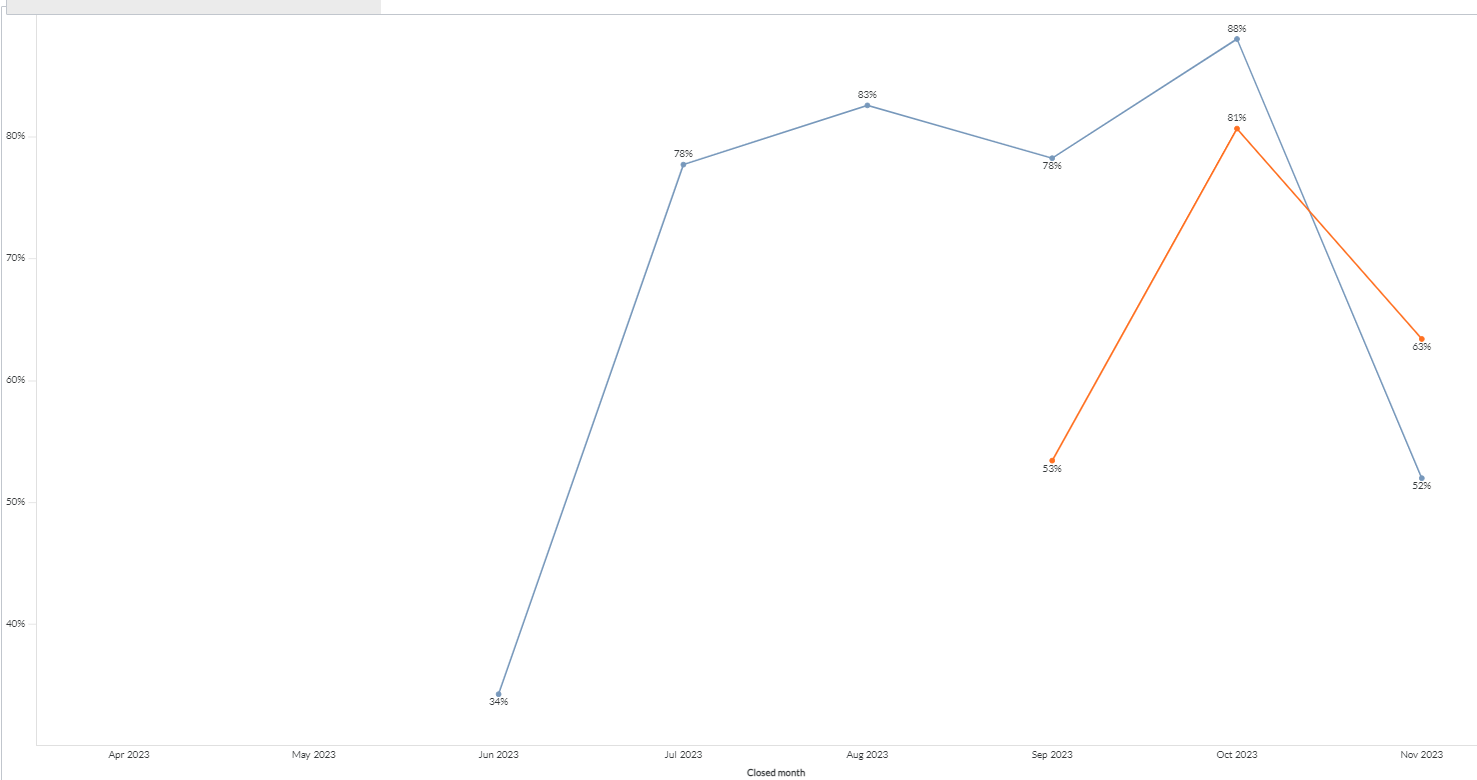
You can use these filters to refine the displayed data. For example, you can choose a program from the Program filter to see the corresponding dashboard. Here is an example program-filtered panel.

Components of dataset
The following components of the dataset are used in this dashboard:
Attributes
| Attribute Name | Description |
|---|---|
| Closed monthly | Closed month of the backlog item |
| Closed quarterly | Closed quarter of the backlog item |
| Completed monthly | Completed month of the backlog item |
| Completed quarterly | Completed quarter of the backlog item |
Metrics
| Metric Name | Description |
|---|---|
| 3 Closed month predictability | Count of backlog item closures over three months. |
| 6 Closed month predictability | Count of backlog item closures over six months. |
| 3 Closed quarter predictability | Count of backlog item closures over three quarters. |
| 6 Closed quarter predictability | Count of backlog item closures over six quarters. |
| 3 Completed month predictability | Count of backlog items that are completed over three months. |
| 6 Completed month predictability | Count of backlog items that are completed over six months. |
| 3 Completed quarter predictability | Count of backlog items that are completed over three quarters. |
| 6 Completed quarter predictability | Count of backlog items that are completed over six quarters. |