SonarQube Plugin
The SonarQube plugin enables Release to work with reports and metrics from a SonarQube server, supporting quality gates and dashboard tiles for your release pipelines.
You must set up a connection to a SonarQube server before adding SonarQube tasks or tiles.
See Set Up a Connection to a Sonar Server.
In the release flow editor, SonarQube tasks have a red border.
Features
- SonarQube Check Compliance, Check Quality, and Check Blocking Violations tasks (create gates in the release flow)
- Set Latest Analysis Version task
- Get Issues, Get Measures, and Get Project Analysis tasks
- SonarQube analysis summary and metrics trend tiles for dashboards
The Check Compliance, Check Quality, and Check Blocking Violations tasks create a gate in the release flow. If the project metrics do not match the metrics configured in the quality gate, these tasks will fail.
Requirements
- A running SonarQube server accessible via HTTP(s)
- FPR artifact uploaded in SonarQube for the application
- Configured SonarQube quality gate
Set Up a Connection to a Sonar Server
- In the navigation pane, under Configuration, click Connections.
- Under HTTP Server Connections, next to Sonar:Server, click
 .
. - Enter a Title for the configuration.
- Enter the URL of the server.
- Select an Authentication method:
- None
- Basic
- NTLM
- PAT
- OAuth2
- If required, enter authentication and proxy details.
- Click Test to verify the connection.
- Click Save.
SonarQube Tasks
The following tasks are available to help you integrate SonarQube analysis and quality gates into your Release pipelines. Each task type is described below with configuration steps and usage details.
Check Compliance
-
In a Release template, add a task: SonarQube > Check Compliance.
-
Select the Sonar server in the Server field.
-
Enter the project ID in the Resource field.
-
Enter the Branch or Pull Request (default: master branch).

Check Quality
-
Add a task: SonarQube > Check Quality.
-
Select the Sonar server.
-
Enter the project ID (Resource).
-
Enter Branch or Pull Request.
-
Set thresholds for:
- Line Coverage (%)
- Complexity
- Duplicated Lines Density (%)
- Violations
-
To skip a field, enter
-1.noteTo skip the fields like Line Coverage, Complexity, Duplicated Lines Density, and Violations during validation, enter
-1as the value.
Check Blocking Violations
-
Add a task: SonarQube > Check Blocking Violations.
-
Select the Sonar server.
-
Enter the project ID (Resource).
-
Enter Branch or Pull Request.
-
Set thresholds for:
- Blocker Violations
- Critical Violations
- Major Violations
-
To skip a field, enter
-1.noteTo skip the fields like Blocker Violations, Critical Violations, and Major Violations during validation, enter
-1as the value.
Set Latest Analysis Version
-
Add a task: SonarQube > Set Latest Analysis Version.
-
Select the Sonar server.
-
Enter the project ID (Resource).
-
Enter the Version to set.
-
Enter Branch or Pull Request.

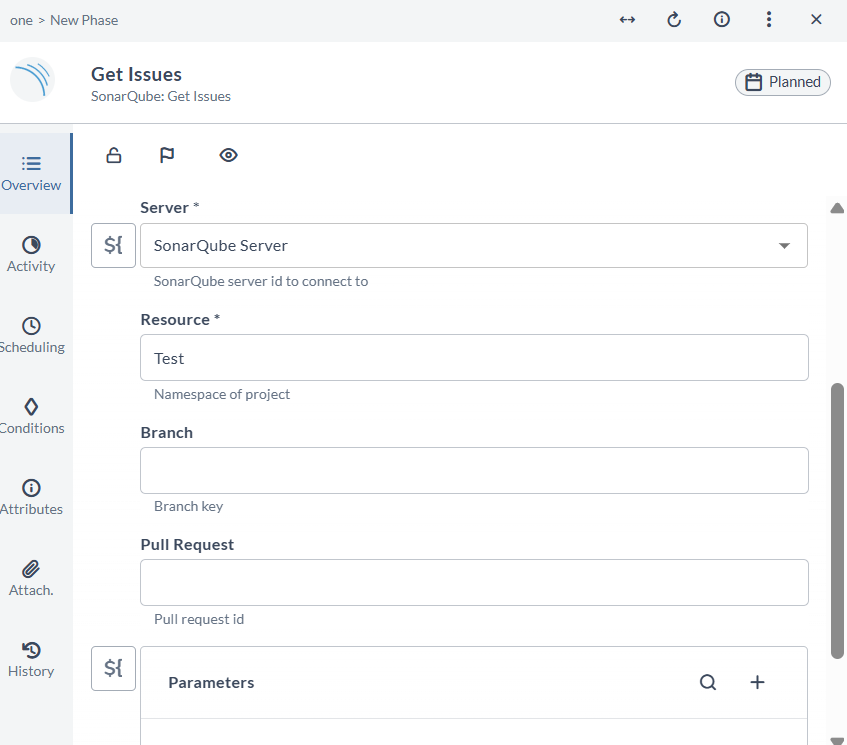
Get Issues
-
Add a task: SonarQube > Get Issues.
-
Select the Sonar server.
-
Enter the project ID (Resource).
-
Enter Branch or Pull Request.
-
Enter any additional Parameters.
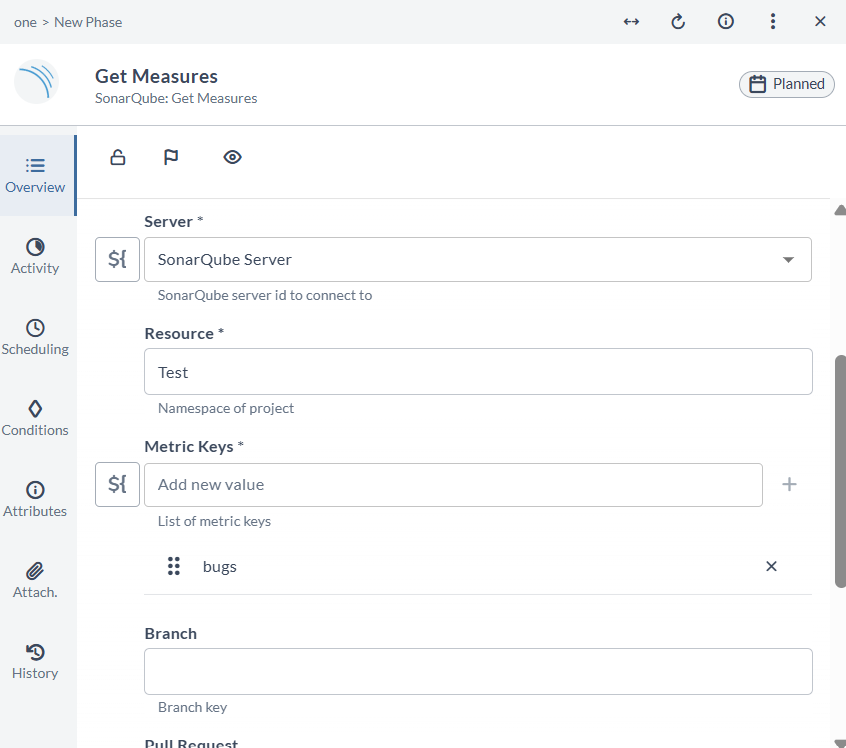
Get Measures
-
Add a task: SonarQube > Get Measures.
-
Select the Sonar server.
-
Enter the project ID (Resource).
-
Enter Branch or Pull Request.
-
Enter Metric Keys.
-
Enter any additional Parameters.
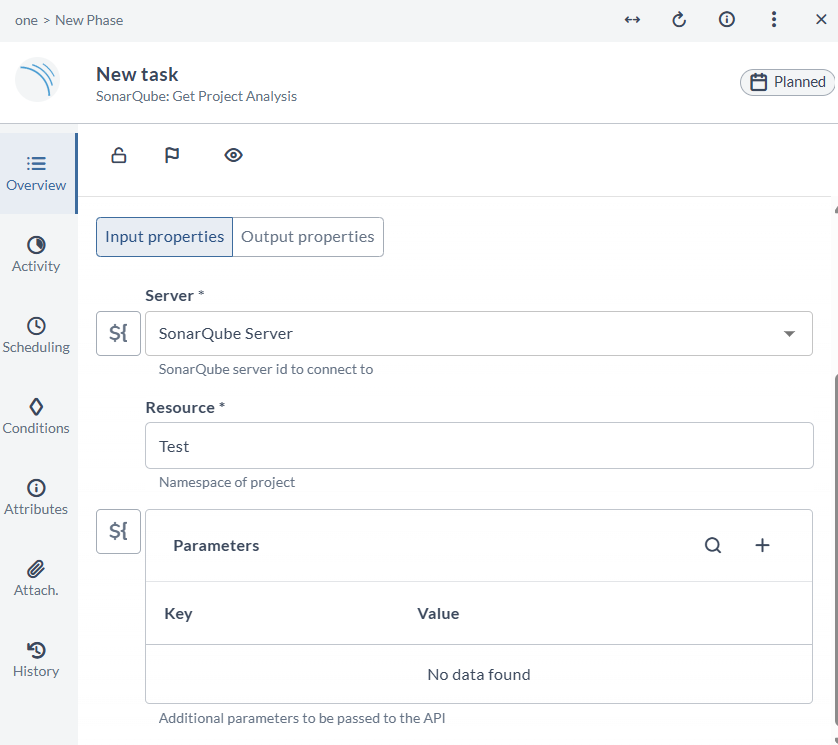
Get Project Analysis
-
Add a task: SonarQube > Get Project Analysis.
-
Select the Sonar server.
-
Enter the project ID (Resource).
-
Enter any additional Parameters.
Dashboard Tiles
Add a SonarQube Analysis Summary Tile
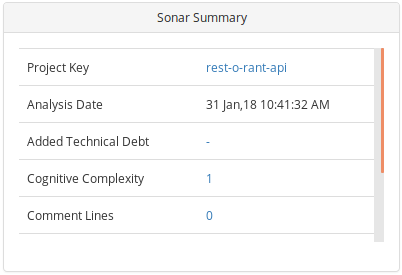
The SonarQube analysis summary tile displays metrics for the selected project and version.
-
Click Dashboards in the navigation bar.
-
Select a dashboard or create a new one.
noteTo create a new dashboard, click Add dashboard and provide a name for the dashboard.
-
Click Configure dashboard.
-
Click Add tiles.
-
Hover over SonarQube analysis summary and click Add.
-
Configure the tile:
- Title: Name for the tile
- Server: SonarQube server name
- Project: Project ID
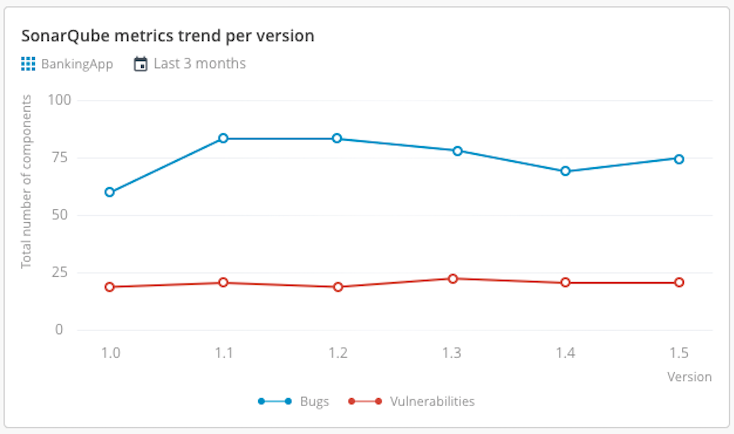
Add a SonarQube Metrics Trend Per Version Tile
-
Click Dashboards in the navigation bar.
-
Select a dashboard.
-
Click Configure dashboard.
-
Click Add tiles.
-
Hover over SonarQube metrics trend per version and click Add.
-
Configure the tile:
- Title
- Server
- Project
- Metrics (all must be of the same type, for example, percentage)
noteOnce the metrics type is selected, the same metrics type will be applicable for all metrics that are measured. For example, if you select a metric that is measured as a percentage, then all other metrics are measured in percentages only.
-
In the Version filter field, select the versions to display.
noteVersion filters follow semantic versioning. A custom regex can also be used, provided that it is Python compatible.
-
In the Render as field, select the type of chart to display.
-
Click Save.