Overview of Dashboard Tiles
The release dashboard tiles topic provides you with an overview of your planning information with the help of graphical representations. The release dashboard can be customized as per your requirement by adding, configuring, moving, and removing tiles to show the planning information and details about the release status.

The topic also provides an overview of all the tiles that are available in Digital.ai Release. Click Configure dashboard to add, remove, or move tiles. For more information, see Using the release dashboard.
Default tiles
The Digital.ai Release consists of various default tiles like:
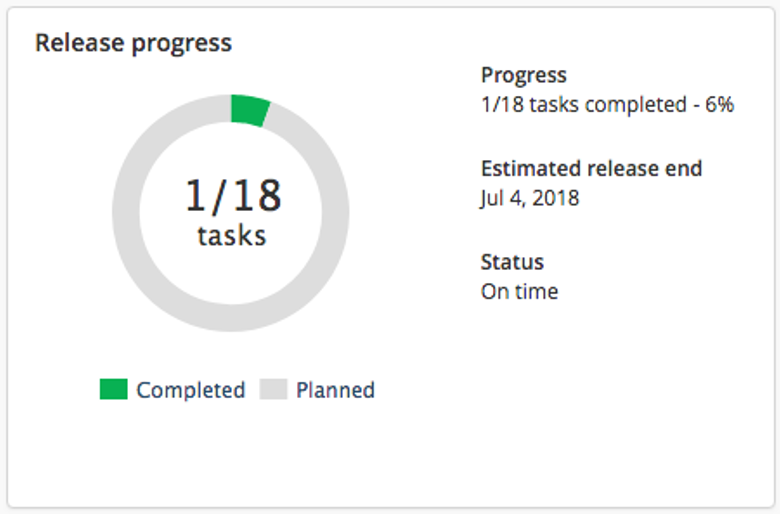
Release progress tile
The release progress tile shows the number of completed tasks and indicates if the release is progressing according to the schedule.

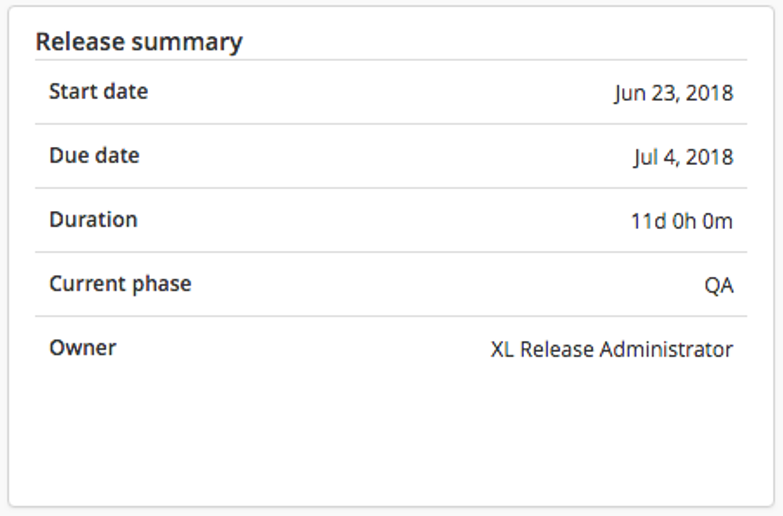
Release summary tile
The release summary tile shows the start and due dates, duration, current phase, and owner of the template or release.

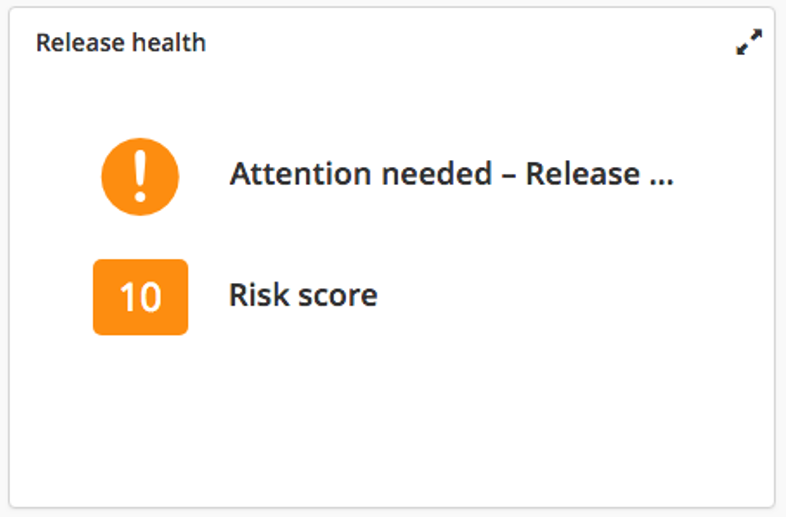
Release health tile
The release health tile shows an icon that indicates the health of the release and the maximum risk score of the release.

The icon color indicates:
| Color | Description |
|---|---|
| Red | The release is in a failed state, or there are one or more red ("release at risk") status flags on the release. |
| Amber | The calculated end date of the release is after its configured due date, or there are one or more yellow ("attention needed") flags on the release. |
| Green | There are no issues with the release. |
To see detailed information about release status flags, click the tile to open its detail view.
Release timeline tile
The release timeline tile shows a timeline of the release and its phases.

The timeline start and end dates are displayed depending on the state of the phase or task:
- If the task has not started, the scheduled start date and scheduled due date are displayed.
- If the task is complete, the actual start date and end date is displayed.
- If the task is in progress, the displayed start date is the actual start date. If the task is on predefined schedule and the predefined scheduled start date is after the current date, the displayed end date is the scheduled start date. Otherwise, the end date is the current date.
To see detailed information, including other releases that depend on or block this release, click the tile to open its detail view.
Resource usage tile
The resource usage tile shows an overview of the number of tasks assigned to users in the template or release.

To see detailed information about task assignment across all users and teams, click the tile to open its default view.
Additional tiles
Along with the default tiles Digital.ai Release provides additional tiles like:
JIRA query tile
The JIRA query tile retrieves information from an Atlassian JIRA server based on a JQL query that you specify in the tile configuration. The tile summarizes issues by their status in JIRA.
To see the list of JIRA issues that are shown, click the tile to open its detail view.
Jenkins builds tile
The Jenkins build tile provides an overview of the status of Jenkins jobs started by the release.
To see the list of Jenkins builds that are shown, click the tile to open its detail view.
If the template or release does not contain any Jenkins tasks, this tile will not show any data.
Task progress tile
The task progress tile shows an overview of the progress of tasks that are tagged with a tag or tags that you specify.
Deploy tile
The Deploy deployments tile shows information about deployments that were started from the release.
To see a list of the deployments, click the tile to open its detail view.
If the template or release does not contain any Deploy tasks, this tile will not show any data.
XLD Version Tile
XLD Version Tile shows information about deployed applications on an environment at a specific moment in time.
Blackduck Risk Profile tile
The Blackduck Risk Profile tile shows a summary of a risk type displayed as a graph, for example: Security Risk, License Risk, or Operational Risk. For more information, see Blackduck Risk Profile tile.
Fortify Summary tile
The Fortify Summary tile creates a dashboard tile that displays the metric information of the selected project and version. For more information, see Fortify Summary tile.
Sonar Summary tile
The Sonar Summary tile creates a dashboard tile that displays the metrics on the selected project and version. For more information, see Sonar Summary tile.
Markdown Text tile
The Markdown Text tile is used to provide usage instructions and descriptions to dashboard users. You can also use this tile for various documentation snippets, bookmarks, etc. For more information, see Markdown Text tile.