Logging in Deploy
This topic provides information about the logs in Deploy.
By default, the Deploy server writes informational, warning, and error log messages to standard output and to XL_DEPLOY_SERVER_HOME/log/deployit.log when it is running. In addition, Deploy:
- Writes an audit trail to the
XL_DEPLOY_SERVER_HOME/log/audit.logfile - Writes an HTTP log to the
XL_DEPLOY_SERVER_HOME/log/access.logfile - Can optionally log scripts in the
XL_DEPLOY_SERVER_HOME/log/scripts.logfile - Can optionally log entries to the
XL_DEPLOY_SERVER_HOME/log/profiling.logfile to track queries, query parameter values, and the time taken by queries
The Audit Log
Deploy writes an audit log for each human-initiated event on the server. As of Deploy version 9.8*, some of the events that are logged in the audit trail are:
- The system is started or stopped
- An application is imported
- A CI is created, updated, moved, or deleted
- A security role is created, updated, or deleted
- A task (deployment, undeployment, control task, or discovery) is started, cancelled, or aborted
- Login, logout, and failed log in attempts by the user
For each event, the following information is recorded:
- The user making the request
- The event timestamp
- The component producing the event
- An informational message describing the event
For events involving configuration items (CIs), the CI data submitted as part of the event is logged in XML format.
By default, the audit log is stored in XL_DEPLOY_SERVER_HOME/log/audit.log and is rolled over daily.
Configure Audit Logging
It is possible to change the logging behavior (for example, to write log output to a file or to log output from a specific source). To do so, edit the XL_DEPLOY_SERVER_HOME/conf/logback.xml file. This is a sample logback.xml file:
<configuration>
    <appender name="STDOUT" class="ch.qos.logback.core.ConsoleAppender">
        <!-- encoders are assigned the type
             ch.qos.logback.classic.encoder.PatternLayoutEncoder by default -->
        <encoder>
              <pattern>
                %d{yyyy-MM-dd HH:mm:ss.SSS} [%thread] %-5level %logger{36} - %msg%n
            </pattern>
        </encoder>
    </appender>

    <!-- Create a file appender that writes log messages to a file -->
    <appender name="FILE" class="ch.qos.logback.core.FileAppender">
        <layout class="ch.qos.logback.classic.PatternLayout">
            <pattern>%-4relative [%thread] %-5level %class - %msg%n</pattern>
        </layout>
           <File>log/my.log</File>
    </appender>

    <!-- Set logging of classes in com.xebialabs to DEBUG level -->
    <logger name="com.xebialabs" level="debug"/>

    <!-- Set logging of class HttpClient to DEBUG level -->
    <logger name="HttpClient" level="debug"/>

    <!-- Set the logging of all other classes to INFO -->
    <root level="info">
        <!-- Write logging to STDOUT and FILE appenders -->
        <appender-ref ref="STDOUT" />
        <appender-ref ref="FILE" />
    </root>

</configuration>
Configure HTTP Access Logging
You can change the HTTP access logging behavior in the XL_DEPLOY_SERVER_HOME/conf/logback-access.xml file. The format is slightly different from the logback.xml format.
By default, the access log is done in the so-called combined format, but you can fully customize it. The log file is rolled per day on the first log statement in the new day.
This is a sample logback-access.xml file:
<configuration>
  <appender name="FILE" class="ch.qos.logback.core.rolling.RollingFileAppender">
    <file>log/access.log</file>
    <rollingPolicy class="ch.qos.logback.core.rolling.TimeBasedRollingPolicy">
      <fileNamePattern>log/access.%d{yyyy-MM-dd}.log.zip</fileNamePattern>
    </rollingPolicy>

    <encoder>
      <pattern>%h %l %u [%t] "%r" %s %b "%i{Referer}" "%i{User-Agent}"</pattern>
    </encoder>
  </appender>

  <appender-ref ref="FILE" />
</configuration>
For information about the configuration and possible patterns, refer to:
To disable the HTTP access log, create a logback-access.xml file with an empty configuration element:
<configuration>
</configuration>
Enable the Script Log
The logback.xml file contains a section that allows you to enable logging of all Deploy scripts to a separate log file called XL_DEPLOY_SERVER_HOME/log/scripts.log. By default, this section is commented out.
Important: The scripts contain base64-encoded passwords. Therefore, if script logging is enabled, anyone with access to the server can read those passwords.
Logging is configured in the XL_DEPLOY_SERVER_HOME/conf/logback.xml file. To enable debug mode, change the following setting:
<root level="debug">
	...
</root>
If this results in too much logging, you can tailor logging for specific packages by adding log level definitions for them. For example:
<logger name="com.xebialabs" level="info" />
You must restart the server to activate the new log settings.
See Logback documentation for more information.
Enable SQL Query Log
To enable logging for SQL queries performed at the DB level, modify the logback.xml with the following logger:
<logger name="org.springframework.jdbc.core" level="trace" />
Enable Profiling Logs for SQL Queries
- Profiling can be enabled in Deploy which lets you log query details such as query parameters and time taken by a query to the
XL_DEPLOY_SERVER_HOME/log/profiling.logfile. - The
XL_DEPLOY_SERVER_HOME/log/profiling.logfile is rotated the same way as other log files are.
-
Edit the
logback.xmlfile with the following:- Set the
org.springframework.jdbc.corelogger entry todebug. - Add the
ai.digital.deploy.profilinglogger entry todebug.
Here's an example:
<logger name="org.springframework.jdbc.core" level="debug" additivity="false">
        <appender-ref ref="PROFILING"/>
</logger>
<logger name="ai.digital.deploy.profiling" level="debug" additivity="false">
     <appender-ref ref="PROFILING"/>
</logger>Note: No logs are posted to the
XL_DEPLOY_SERVER_HOME/log/profiling.logfile if you start the Deploy application without the-profilingargument. However, basic debug statements for that module are logged when you set theorg.springframework.jdbc.corelogger entry todebuglevel or to a logging level aboveWarn. - Set the
-
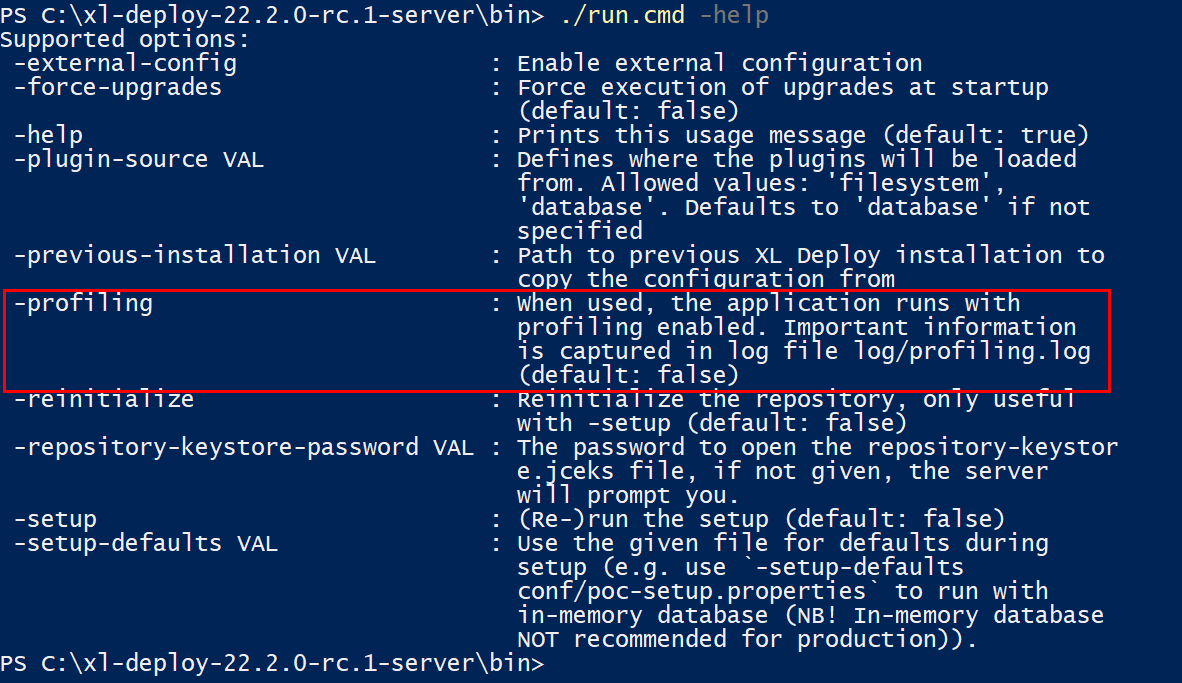
Start the Deploy server with the
-profilingargument to track queries, query parameter values, and the time taken by queries.
Here's an example log data from the
XL_DEPLOY_SERVER_HOME/log/profiling.logfile:2022-06-14 14:29:17.416 [a.d.d.p.persistence.DatabaseProfiler] [CorrelationID : 4b57ebdc-7dd5-4638-b4c1-a35f03df2afc][Execution Time : 00000001497000 nano seconds] [Query: select count(1) from "XLD_CIS" where "ci_type" in (?,?)] [Values : ExtendedArgumentPreparedStatementSetter(List(xl.Satellite, xl.SatelliteGroup))]