Grid - Performance Transaction Commands
A performance report is available when executing a transaction. The report contains the following measurements from the browser:
-
Duration - The transaction durations in milliseconds.
-
Speed Index - Provides a computed overall score of how quickly the final content was painted.

- The above performance report is an example and can be viewed in SeeTest Reporter.
- To enable the Speed Index calculation in the report, please contact Continuous Testing Support.
- A transaction maximum time is 5 min. After 5 minutes transaction will be canceled
- The transaction will be canceled if driver.quit() is performed. No data will be saved
Report data:
- The upper left-hand side is the transaction name and application data (name and version)
- The upper right-hand side is the browser information (name, model, OS, Resolution, and Network Profile)
- The rectangles on the right show the measurements of the transaction
StartPerformanceTransaction
Start Performance Transaction collects data on the duration of the browser.
The command must be used with the following EndPerformanceTransaction
the parameter "App version" is for reporter use
driver.executeScript("seetest:client.startPerformanceTransaction(\"App version\")");
EndPerformanceTransaction
End Performance Transaction must be performed after StartPerformanceTransaction. It takes the collected data on the duration and speed index of the test on the current browser and uploads it to SeeTest Reporter.
The collected data can be viewed under the transaction tab in SeeTest Reporter.
The parameter "Transaction name" is for reporter use
Object o = driver.executeScript("seetest:client.endPerformanceTransaction(\"Transaction name\")");
Example Expand source
import org.junit.After;
import org.junit.Before;
import org.junit.Test;
import org.openqa.selenium.remote.DesiredCapabilities;
import org.openqa.selenium.remote.RemoteWebDriver;

import java.net.MalformedURLException;
import java.net.URL;

public class PerformanceTransaction {
    private RemoteWebDriver driver;

    @Before
    public void setUp() {
        DesiredCapabilities dc = new DesiredCapabilities();
        URL url = null;
        try {
            url = new URL("<Cloud URL>");
        } catch (MalformedURLException e) {
            e.printStackTrace();
        }
        dc.setCapability("username", "<username>");
        dc.setCapability("password", "<password>");
        driver = new RemoteWebDriver(url, dc);
    }

    @Test
    public void PerformanceTransactionTest() {
        driver.executeScript("seetest:client.startPerformanceTransaction(\"App Version\")");
        driver.get("https://www.netflix.com/il-en/login");
        Object o = driver.executeScript("seetest:client.endPerformanceTransaction(\"TransactionName\")");
        System.out.println(o.toString());
    }

    @After
    public void tearDown() {
        driver.quit();
    }
}
Har Recording
Network traffic (HAR) will not be recorded in the transaction if tunneling is turned on
Start/Stop captures HAR during transactions for a cloud browser. The capture will start when startPerformanceTransaction is executed.
The capture will stop when endPerformanceTransaction is executed.
Recording HTTPS Traffic requires a configuration by the Cloud admin, for more instruction click here
HAR files are produced only after the end of the test, you can view/download them after the test is finished and not during it's execution(for example in java written test the HAR file are produced after driver.quit()).
Parameters
| capability | Value | Description |
|---|---|---|
| key | String | useNV |
| value | boolean | true/false (false by default) |
After the test you can go to the report that has the HAR file attached you can view it by clicking the 3 dot button at the right of the transaction's name:
View HAR File Example
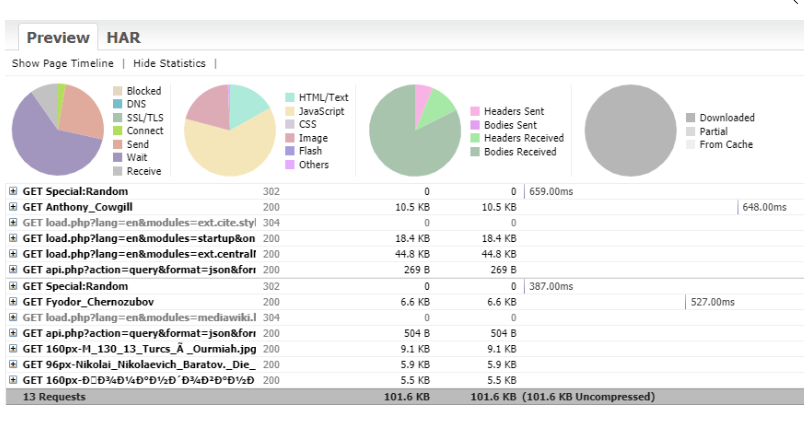
HAR files can be viewed using a HAR file viewer. The latest version of the HAR file viewer created by Jan Odvarko (odvarko@gmail.com), the project can be found here.

The purpose of this tool is to visualize the HTTP Archive (HAR) log files created by HTTP tracking tools.
These files contain a log of HTTP client/server conversation and can be used for additional analysis of e.g. page load performance.
Basic usage
Preview tab in the HAR file viewer shows the list of HTTP requests recorded with all its basic details like
- method
- URL
- response status
- response (compressed and uncompressed)
- response time

You can see further details by clicking on the plus icon:

HAR tab in the HAR file viewer, you can inspect the "raw" values of the har file as JSON tree:
