Release Value Stream Report
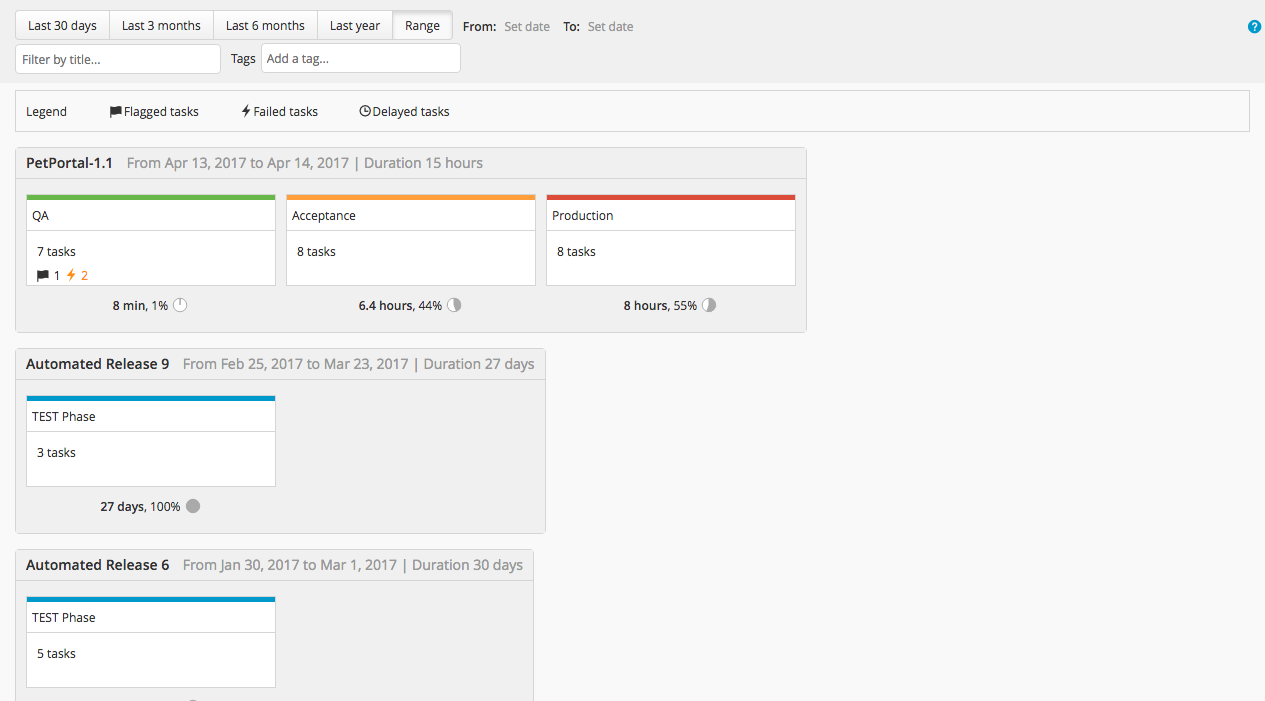
This topic provides information on the Release value stream report, which evaluates the quality of completed and aborted releases. The report draws data from the Release archive database, so it does not include releases that are completed or aborted but not yet archived. For more information, see completed and aborted and archive database.
Releases appear in this report in descending order. Under each phase of a release, you can see its duration and the proportion of the total duration that the phase took.
To access the Release release value stream report: In the left navigation bar, click Reports and Release value stream. Use the buttons at the top of the report to select a time period such as "Last 6 months" or a specific date range. To filter the list based on title, enter a title into the Filter by title... field. To filter based on tag, enter a tag into the Add a tag... field.

Phase metrics and critical phases
Each release phase can show these criticality metrics:
- Flags: Total number of flags that were added to tasks in the phase.
- Failures: Total number of task failures in the phase.
- Delays: Total number of tasks in the phase that were completed after their due date.
Release marks a phase as "critical" when the sum of these metrics is greater than 6. You can customize this value in the report settings.
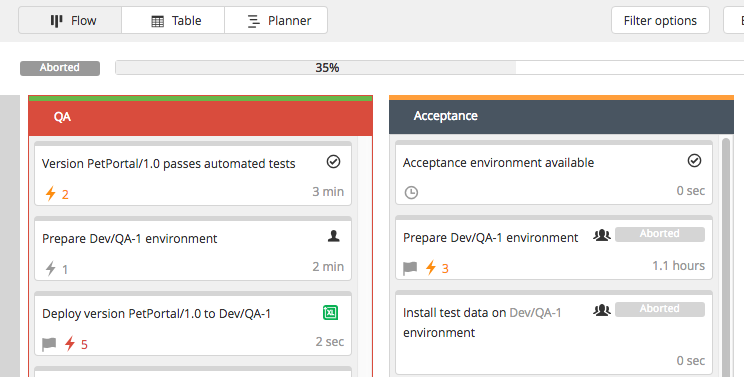
The name of a critical phase appears on a red background. The total number of critical phases in a release is shown in the release header.
Filter tasks
You can filter tasks by metric. Use the Show clean tasks option to see tasks for which all metrics are zero.

Open a release
Click a release to open it in the release flow editor.

Each task shows its individual value for the criticality metrics (if non-zero). The failure count appears in yellow if there were at least two failures and in red if there were at least four failures. You can customize these values in the report settings.