Reporting in TeamForge
Important: Unless otherwise stated, you must have datamart enabled on your site to create reports in TeamForge. Note that a few Distribution Reports use data from TeamForge's operational database.
You can specify the time at which the reporting data is refreshed from the production database. By default, the extraction takes place daily at 2:30 a.m. in the TeamForge application server's time zone. See Schedule Data Extraction for Reporting.
You can use reports to display data and group relevant information appropriately and specify intervals at which the datamart extracts TeamForge data from the datamart. For advanced reporting options and datamart information, see Advanced Reporting and Datamart Access.
You can also use external reporting tools to connect to the datamart and generate customized reports. See Datamart Access Using External Tools.
You can now refresh your reports to get the most recent data. You can also see the date and time when the report was last generated. Clicking the Refresh icon would fetch the latest available data from the respective data source (Operational DB or Datamart).
Reporting Framework
Here's a list of some of the advantages of the new reporting framework:
- Reporting under one umbrella with a central dashboard of reports.
- Cross-project reporting capability.
- Tracker custom defined fields are in datamart and can be used to filter.
- You can query and write custom reports.
- All data, including event, associations, and traceability data, can be queried through an elegant API for custom reporting and data extraction.
- High charts-based interactive data visualization charts. You can hover over the charts to see data points, click legends in the chart to toggle specific data point in and out of the chart and so on.
- You can drill one level down on some of the activity reports using column charts to get more clarity on the data points of your interest.
- Categorization of reports.
- Improved usability: Hassle free report creation with new widgets for selecting report criteria such as planning folders, trackers and repositories.
- Ability to save 'Public' and 'Private' reports: While 'Public' reports are visible to all project members with view reports permission, 'Private' reports are only for your consumption. You cannot publish 'Private' reports in project pages.
Reports--Role Based Access Control
In general, TeamForge site and project administrators, and users with tracker and task view permissions can see the REPORTS button on the project navigation bar.
-
Object-based access permissions - If you are a TeamForge user, your ability to create, edit, preview or view reports depends on whether you have permission to access specific objects such as trackers and repositories in TeamForge. For example, to generate a report on the number of SCM commits in a repository, you must have permission to access the repository. Otherwise, a message such as "You do not have sufficient permission to perform this operation" is displayed.
-
Task and Tracker reports (Table reports) -
Task and Tracker Viewpermission is required to generate task and tracker reports. You must haveView Activitypermission or object-level permission to view Activity reports such as SCM Commits, Build Activity, Build and Test Activity, Artifact Created and Artifact Closed reports. -
Context-sensitive access permission - Reports are shown or hidden from users based on the context. For example, a user must have
View Project Pagepermission to view reports published on a project home page. -
Deleting reports - Site and project administrators can delete reports. In addition, you can delete your own reports.
Reports Available in TeamForge
Reports in TeamForge are grouped under the following categories.
- Activity Reports
- Agile Reports
- Distribution Reports
- Trend Reports
- Table Reports: Task and Tracker Reports
Activity Reports
Here's a list of TeamForge activity reports such as the SCM commits, artifact created and closed reports.
These are reports to track activities such as SCM commits, artifact creation and closure, build and test activities and so on.
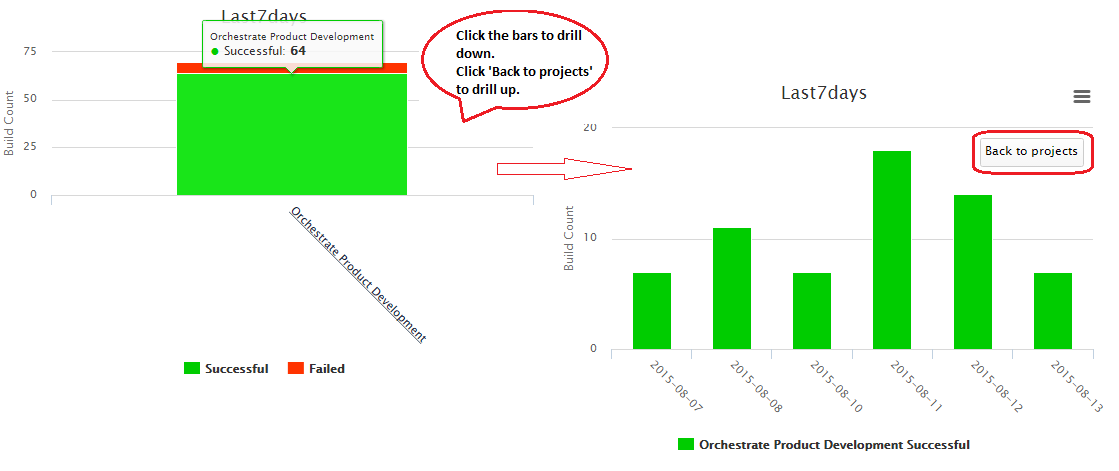
You can also drill one level down on some of the activity reports using column charts to get more clarity on the data points of your interest.
SCM Commits
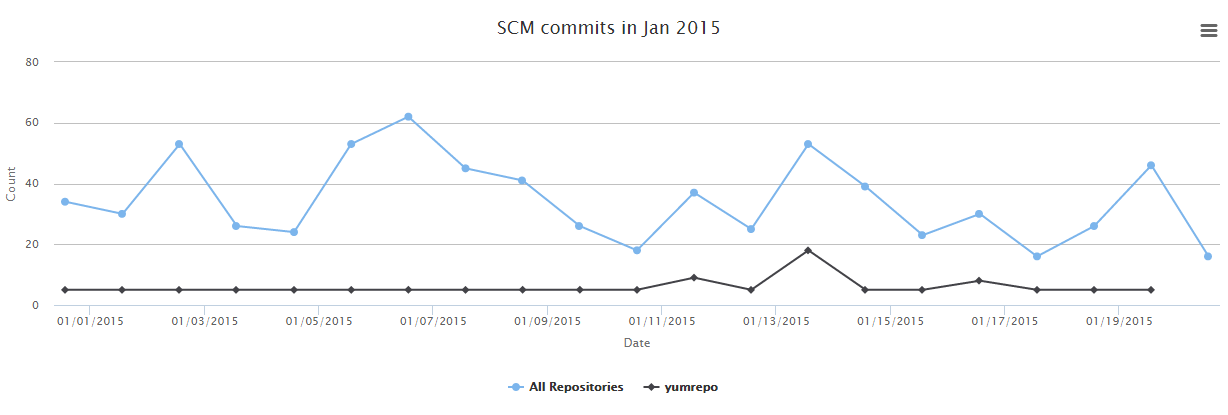
Shows the number of commits in one or more selected repositories in a given time period.
-
Click REPORTS from the Project Home menu.
-
Click Create in the List Reports page. The Select Report Type page appears.
-
Select Scm Commits from Activity Reports.
-
Type a report title and description.
-
Select one or more repositories from the SELECT REPOSITORY(S) drop-down list.
-
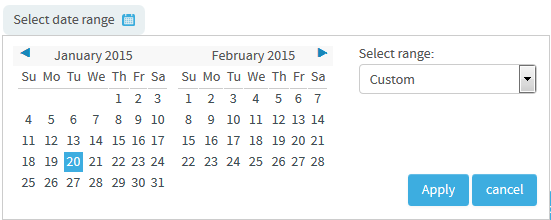
Select date range and click Apply. To set the date range, select the start date first and then the end date. Use the month/year navigation arrows to select the month/year you want. If you don't have the exact dates at hand, you can also select one of the time periods from the Select Range: Custom drop-down list.
-
Select a chart type such as 'Line' or 'Bar' or 'Column' from the CHART DISPLAY TYPE drop-down list.
-
Select report visibility:
PublicorPrivate. -
Click Preview.
-
Click Create. The report is created and the View Report page appears.
Print or download charts
You can print charts or download them as .PNG, .JPG, .SVG or .PDF files using the print/download quick function icon.
-
Click Back to Reports List to go back to the Reports dashboard.
Artifact Created
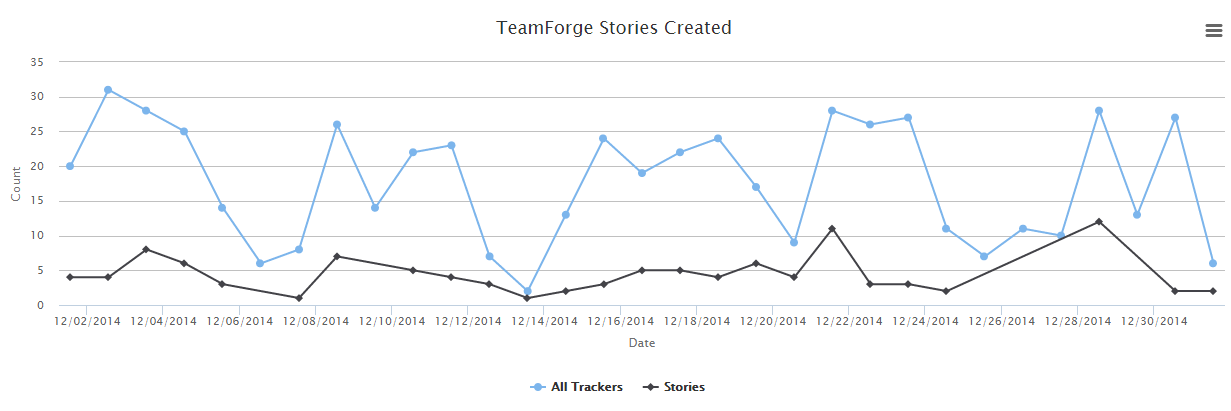
Shows the numer of artifacts created in one or more selected trackers in a given time period.
-
Click REPORTS from the Project Home menu.
-
Click Create in the List Reports page. The Select Report Type page appears.
-
Select Artifact Created from Activity Reports.
-
Type a report title and description.
-
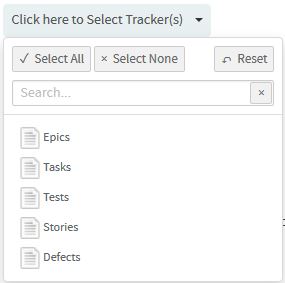
Select one or more trackers from the SELECT TRACKER(S) drop-down list.
-
Select date range and click Apply. To set the date range, select the start date first and then the end date. Use the month/year navigation arrows to select the month/year you want. If you don't have the exact dates at hand, you can also select one of the time periods from the Select Range: Custom drop-down list.

-
Select a chart type such as 'Line' or 'Bar' or 'Column' from the CHART DISPLAY TYPE drop-down list.
-
Select report visibility:
PublicorPrivate. -
Click Preview.
-
Click Create. The report is created and the View Report page appears.
Print or download charts
You can print charts or download them as .PNG, .JPG, .SVG or .PDF files using the print/download quick function icon.
-
Click Back to Reports List to go back to the Reports dashboard.
Artifact Closed
Shows the number of artifacts closed in one or more selected trackers in a given time period.

-
Click REPORTS from the Project Home menu.
-
Click Create in the List Reports page. The Select Report Type page appears.
-
Select Artifact Closed from Activity Reports.
-
Type a report title and description.
-
Select one or more trackers from the SELECT TRACKER(S) drop-down list.

-
Select date range and click Apply. To set the date range, select the start date first and then the end date. Use the month/year navigation arrows to select the month/year you want. If you don't have the exact dates at hand, you can also select one of the time periods from the Select Range: Custom drop-down list.

-
Select a chart type such as 'Line' or 'Bar' or 'Column' from the CHART DISPLAY TYPE drop-down list.
-
Select report visibility:
PublicorPrivate. -
Click Preview.
-
Click Create. The report is created and the View Report page appears.
Print or download charts
You can print charts or download them as .PNG, .JPG, .SVG or .PDF files using the print/download quick function icon.
-
Click Back to Reports List to go back to the Reports dashboard.
Build Activity by Project
Shows the number of builds over a period of time. This report is powered by data from the EventQ's event data store.
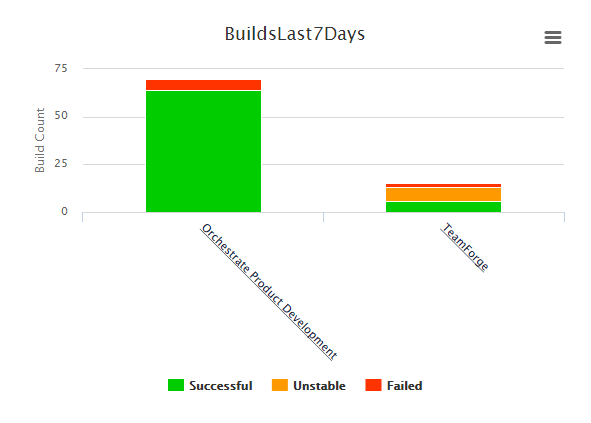
You can drill down this report.
-
Click REPORTS from the Project Home menu.
-
Click Create in the List Reports page. The Select Report Type page appears.
-
Select Build Activity by Project from Activity Reports.
-
Type a report title and description.
-
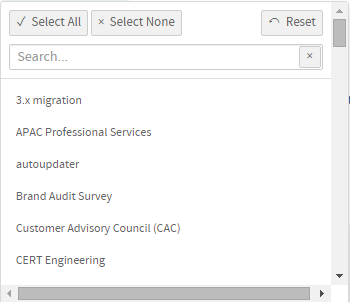
Select one or more projects from the PROJECT(S) drop-down list.
-
Select the number of days from the LAST N DAYS drop-down list.
-
The default Display Type is EventsDrilldown.
-
Select report visibility:
PublicorPrivate. -
Click Preview.
-
Click Create. The report is created and the View Report page appears.
Print or download charts
You can print charts or download them as .PNG, .JPG, .SVG or .PDF files using the print/download quick function icon.
-
Click Back to Reports List to go back to the Reports dashboard.
Agile Reports
Here's a list of TeamForge agile reports such as the release burn up and burn down reports.
Cumulative Flow Chart
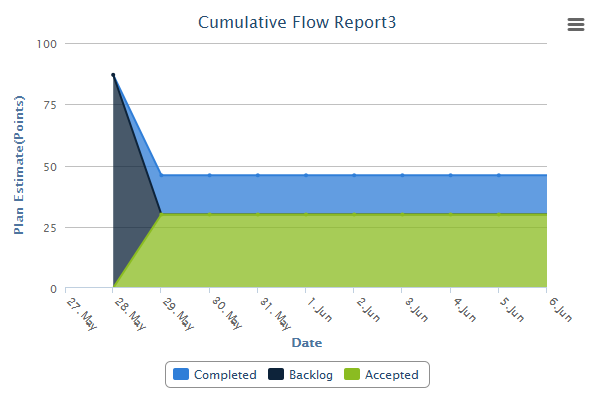
The cumulative flow chart shows the progress of backlog items by status for a sprint or a release.
-
Generate this report to see the rolled up status chart of scheduled work items in a release or a sprint.
-
By viewing the rolled up status of backlog items by date, you can forecast whether you are on track or not, adjust the scope if required and identify bottlenecks in your release or sprint.
-
You have 'Date' in the X axis and 'Plan Estimate' in terms of number of points in the Y axis.
-
Click REPORTS from the Project Home menu.
-
Click Create in the List Reports page. The Select Report Type page appears.
-
Select Cumulative Flow Chart from Agile Reports.
-
Type a report title and description.
-
Select a planning folder from the SELECT PLANNING FOLDER(S) drop-down list.
-
Select one or more trackers from the SELECT TRACKER(S) drop-down list.

-
Leave the CHART DISPLAY TYPE as Area, which is the only available chart type for this report.
-
Select report visibility:
PublicorPrivate. -
Click Preview.
-
Click Create. The report is created and the View Report page appears.
Print or download charts
You can print charts or download them as .PNG, .JPG, .SVG or .PDF files using the print/download quick function icon.
-
Click Back to Reports List to go back to the Reports dashboard.
Release Burn Up Chart
The Release Burn Up Chart shows the work progress to date against the total planned work. This chart shows the total planned work, total work completed to date and the rate of progress (velocity).
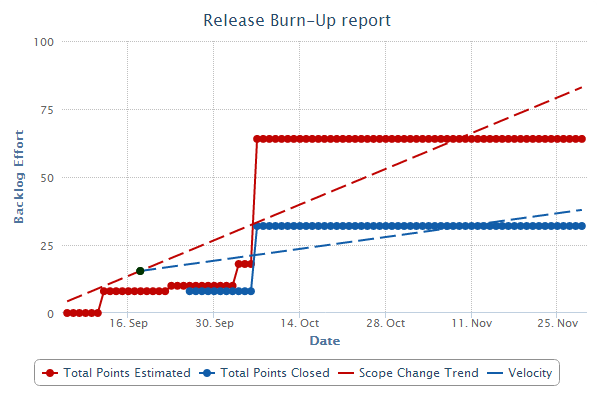
You must have the planning folder's start and end dates defined to generate this chart.
This chart includes a trend line to show the planned work scope change between a release's start and end dates (in other words, the start and end dates of the release's planning folder). Optionally, you can also include a trend line in the chart that forecasts when planned work might be completed depending on the average rate of progress (velocity).
-
Click REPORTS from the Project Home menu.
-
Click Create in the List Reports page. The Select Report Type page appears.
-
Select Release Burn Up Chart from Agile Reports.
-
Type a report title and description.
-
Select a planning folder from the SELECT PLANNING FOLDER(S) drop-down list.
-
Select one or more trackers from the SELECT TRACKER(S) drop-down list.

-
Optionally, select the Include Forecast check box.
-
Select either
PointsorHours. -
Leave the CHART DISPLAY TYPE as
Trendlines, which is the only available chart type for this report. -
Select report visibility:
PublicorPrivate. -
Click Preview.
-
Click Create. The report is created and the View Report page appears.
Print or download charts
You can print charts or download them as .PNG, .JPG, .SVG or .PDF files using the print/download quick function icon.
-
Click Back to Reports List to go back to the Reports dashboard.
Burn Down Chart
The Burn Down Chart shows your project's progress on a daily basis.
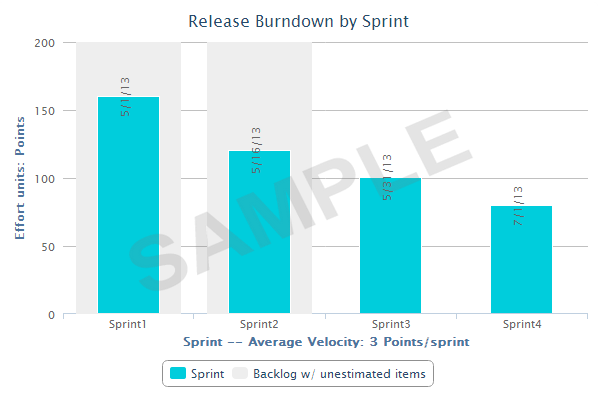
As work gets completed sprint-by-sprint for a release, your backlog tends to decrease. The burn down chart tells the story of how much work is left to be done versus how much time is left. With time along the X axis, the amount of work (backlog) measured in story points is on the Y axis. You can also see the average velocity per sprint in the release burn down chart.In addition to creating burn down charts by release, you can configure this report for a selected sprint planning folder to see its progress on a day-to-day basis.
- The story told in your burn down chart is only as reliable as the underlying data.
- You must have the planning folder's start and end dates defined to generate this chart.
- You can have the POINTS field enabled or disabled for a tracker. If a release planning folder consists of both "points-enabled" and "points-disabled" trackers, the release burn down chart shows grey-colored bars for all sprints, meaning, there are work items without points estimation data. This is because, the "points-disabled" tracker work items are considered as unestimated backlog items as they don’t have points data. As a workaround, while configuring the release burn down chart, you can include "points-enabled" trackers alone to have the release burn down chart behave as expected.
Things to consider if you are generating burn down chart for a release planning folder
-
It is recommended to have all your sprint planning folders organized hierarchically within your release planning folder. Release burn down chart can be generated only if that planning folder has child (sprint) planning folders.
-
Within a selected release planning folder, all immediate child planning folders are considered as sprint planning folders.
-
The bar chart shows the work left to be done (estimated as points) on the first day of every sprint.
-
The release burn down calculation is based on (story) points and no effort data is considered. Meaning, the release burn down will not behave as expected if you have effort data alone and no points data.
Things to consider if you are generating burn down chart for a sprint planning folder
-
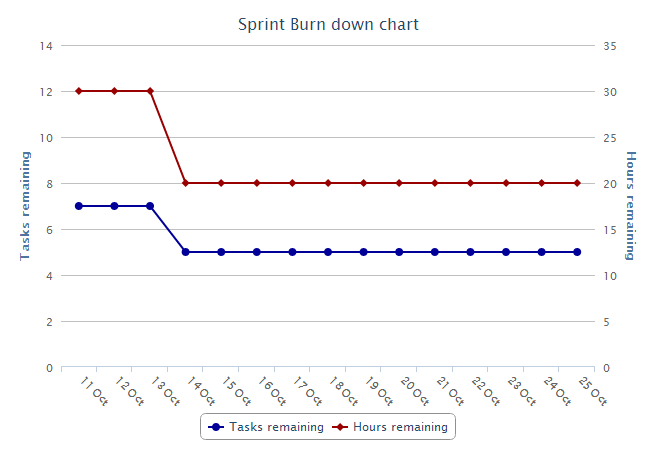
The sprint burn down calculation is based on remaining effort data and no (story) points data is considered. Meaning, the sprint burn down will not behave as expected if you have points data alone and no remaining effort data.
-
You can exclude weekends or specific days from your report if you are creating a burn down chart for a sprint planning folder.
-
The sprint burn down chart shows the number of tasks and hours remaining for a selected sprint planning folder.
-
Click REPORTS from the Project Home menu.
-
Click Create in the List Reports page. The Select Report Type page appears.
-
Select Burn Down Chart from Agile Reports.
-
Type a report title and description.
-
Select a planning folder from the SELECT PLANNING FOLDER(S) drop-down list.
-
Select one or more trackers from the SELECT TRACKER(S) drop-down list.

-
Select one of the options, Release or Sprint, to create burn down chart for either a release planning folder or a sprint planning folder.
tipSelect the Exclude Weekends check box to exclude weekends from the report.
-
Leave the CHART DISPLAY TYPE as
Burndown, which is the only available chart type for this report. -
Select report visibility:
PublicorPrivate. -
Click Preview.
-
Click Create. The report is created and the View Report page appears.
Print or download charts
You can print charts or download them as .PNG, .JPG, .SVG or .PDF files using the print/download quick function icon.
-
Click Back to Reports List to go back to the Reports dashboard.
Committed vs Done vs Missed
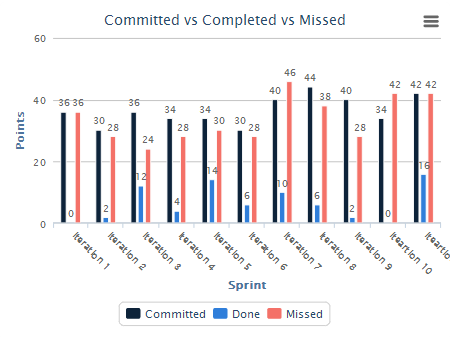
The Committed vs Done vs Missed chart shows a comparison of the amount of work (in terms of story points) committed, completed and missed for a sprint.
-
Click REPORTS from the Project Home menu.
-
Click Create in the List Reports page. The Select Report Type page appears.
-
Select Committed vs Done vs Missed from Agile Reports.
-
Type a report title and description.
-
Select a planning folder from the SELECT PLANNING FOLDER(S) drop-down list.
-
Select one or more trackers from the SELECT TRACKER(S) drop-down list.

-
Leave the CHART DISPLAY TYPE as Columndone, which is the only available chart type for this report.
-
Select report visibility:
PublicorPrivate. -
Click Preview.
-
Click Create. The report is created and the View Report page appears.
Print or download charts
You can print charts or download them as .PNG, .JPG, .SVG or .PDF files using the print/download quick function icon.
-
Click Back to Reports List to go back to the Reports dashboard.
Distribution Reports
Here's a list of reports to see distribution of work items such as tracker artifacts by parameters such as status, size, effort and so on.
Status Distribution by Area or Group
You can generate this chart for a specific sprint or release planning folder (optionally you can include child planning folders, if any) and take stock of the number of artifacts in different statuses and have them grouped by Group, Category, Customer, Assigned To, Priority or Teams.
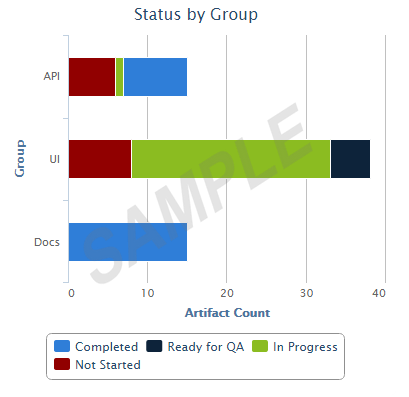
Unlike other reports (that use datamart), this report runs on your operational database.
-
Click REPORTS from the Project Home menu.
-
Click Create in the List Reports page. The Select Report Type page appears.
-
Select Status Distribution by Area/Group from Distribution Reports.
-
Type a report title and description.
-
Select a planning folder from the SELECT PLANNING FOLDER(S) drop-down list.
-
Optionally, select the Include: Child planning folders check box to have the child planning folders, if any, included.
-
Select one or more trackers from the SELECT TRACKER(S) drop-down list.

-
Select an option from the GROUP BY drop-down list to have the chart grouped by
Group,Category,Customer,Assigned To,PriorityorTeams. -
Leave the CHART DISPLAY TYPE as Bar, which is the only available chart type for this report.
-
Select report visibility:
PublicorPrivate. -
Click Preview.
-
Click Create. The report is created and the View Report page appears.
Print or download charts
You can print charts or download them as .PNG, .JPG, .SVG or .PDF files using the print/download quick function icon.
-
Click Back to Reports List to go back to the Reports dashboard.
Total Size by Area or Group
You can generate this chart for a specific sprint or release planning folder (optionally you can include child planning folders, if any) and take stock of the total size (as in total of story points or estimated, actual or remaining effort) of artifacts and have them grouped by Group, Category, Customer, Assigned To, Priority, Tracker or Teams. You can generate this report for all artifacts or just for open or closed artifacts.
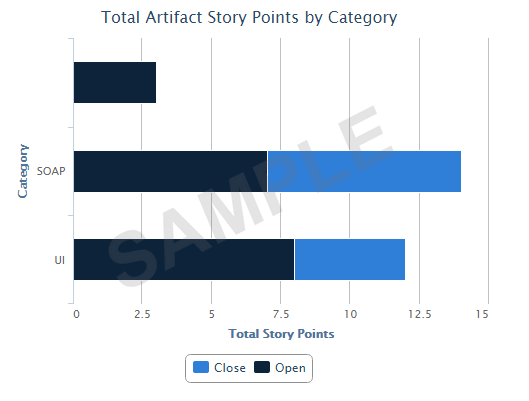
Unlike other reports (that use datamart), this report runs on your operational database.
-
Click REPORTS from the Project Home menu.
-
Click Create in the List Reports page. The Select Report Type page appears.
-
Select Total Size by Area/Group from Distribution Reports.
-
Type a report title and description.
-
Select a planning folder from the SELECT PLANNING FOLDER(S) drop-down list.
-
Select one or more trackers from the SELECT TRACKER(S) drop-down list.

-
Optionally, select the Include: Child planning folders check box to have the child planning folders, if any, included.
-
Select what you want to total from the TOTAL BY drop-down list. You can total by
Story PointsorEstimated EffortorActual EffortorRemaining Effort. -
Select an option from the GROUP BY drop-down list to have the chart grouped by
Group,Category,Customer,Assigned To,Priority,TrackerorTeams. -
Select one of the options, Include artifacts: All (default) or Open or Closed, to include all artifacts or just open or closed artifacts respectively.
-
Leave the CHART DISPLAY TYPE as Bar, which is the only available chart type for this report.
-
Select report visibility:
PublicorPrivate. -
Click Preview.
-
Click Create. The report is created and the View Report page appears.
Print or download charts
You can print charts or download them as .PNG, .JPG, .SVG or .PDF files using the print/download quick function icon.
-
Click Back to Reports List to go back to the Reports dashboard.
Average Size by Area or Group
You can generate this chart for a specific sprint or release planning folder (optionally you can include child planning folders, if any) and take stock of the average size (as in average of story points or estimated, actual or remaining effort) of artifacts and have them grouped by Group, Category, Customer, Assigned To, Priority, Tracker or Teams. You can generate this report for all artifacts or just for open or closed artifacts.
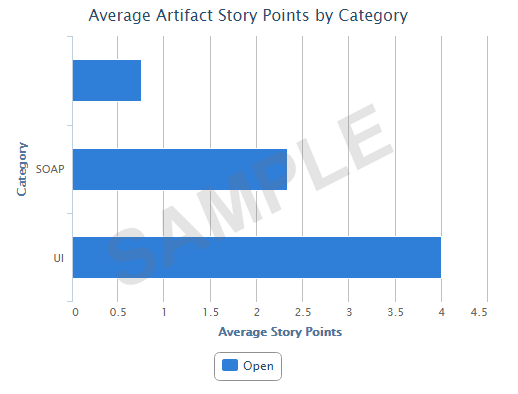
Unlike other reports (that use datamart), this report runs on your operational database.
-
Click REPORTS from the Project Home menu.
-
Click Create in the List Reports page. The Select Report Type page appears.
-
Select Average Size by Area/Group from Distribution Reports.
-
Type a report title and description.
-
Select a planning folder from the SELECT PLANNING FOLDER(S) drop-down list.
-
Optionally, select the Include: Child planning folders check box to have the child planning folders, if any, included.
-
Select one or more trackers from the SELECT TRACKER(S) drop-down list.

-
Select what you want to average from the AVERAGE BY drop-down list. You can average by
Story PointsorEstimated EffortorActual EffortorRemaining Effort. -
Select an option from the GROUP BY drop-down list to have the chart grouped by
Group,Category,Customer,Assigned To,Priority,TrackerorTeams. -
Select one of the options, Include artifacts: All (default) or Open or Closed, to include all artifacts or just open or closed artifacts respectively.
-
Leave the CHART DISPLAY TYPE as Bar, which is the only available chart type for this report.
-
Select report visibility:
PublicorPrivate. -
Click Preview.
-
Click Create. The report is created and the View Report page appears.
Print or download charts
You can print charts or download them as .PNG, .JPG, .SVG or .PDF files using the print/download quick function icon.
-
Click Back to Reports List to go back to the Reports dashboard.
Total Size by Tracker Type
You can generate this chart for a specific planning folder (optionally you can include child planning folders, if any) and take stock of the total size of artifacts belonging to one or more tracker types and have them aggregated by Story Points or Actual Effort or Estimated Effort or Remaining Effort. This report is more useful if you want to know the total size by tracker types for a release and so is typically run against a specific release planning folder. You can generate this report for all artifacts or just for open or closed artifacts.
![]()
Unlike other reports (that use datamart), this report runs on your operational database.
-
Click REPORTS from the Project Home menu.
-
Click Create in the List Reports page. The Select Report Type page appears.
-
Select Total Size by Tracker Type from Distribution Reports.
-
Type a report title and description.
-
Select a planning folder from the SELECT PLANNING FOLDER(S) drop-down list.
-
Optionally, select the Include: Child planning folders check box to have the child planning folders, if any, included.
-
Select what you want to aggregate from the AGGREGATE BY drop-down list. You can aggregate by
Story PointsorEstimated EffortorActual EffortorRemaining Effort. -
Select one of the options, Include artifacts: All (default) or Open or Closed, to include all artifacts or just open or closed artifacts respectively.
-
Leave the CHART DISPLAY TYPE as Bar, which is the only available chart type for this report.
-
Select report visibility:
PublicorPrivate. -
Click Preview.
-
Click Create. The report is created and the View Report page appears.
Print or download charts
You can print charts or download them as .PNG, .JPG, .SVG or .PDF files using the print/download quick function icon.
-
Click Back to Reports List to go back to the Reports dashboard.
Artifact Distribution Chart (Multiple Trackers)
Using this chart, you can report the status of artifacts belonging to more than one tracker or planning folder. You can also create charts based on a combination of more than one tracker and planning folder.
![]()
-
Click REPORTS from the Project Home menu.
-
Click Create in the List Reports page. The Select Report Type page appears.
-
Select Artifact Distribution Chart (Multiple Trackers) from Distribution Reports.
-
Type a report title and description.
-
Select one or more trackers from the SELECT TRACKER(S) drop-down list.

-
Select a planning folder from the SELECT PLANNING FOLDER(S) drop-down list.
-
Select one of the options from the DISTRIBUTE BY drop-down list.
-
Select one of the options from the OPEN VS CLOSE drop-down list.
-
Leave the CHART DISPLAY TYPE as Pie, which is the only available chart type for this report.
-
Select report visibility:
PublicorPrivate. -
Click Preview.
-
Click Create. The report is created and the View Report page appears.
Print or download charts
You can print charts or download them as .PNG, .JPG, .SVG or .PDF files using the print/download quick function icon.
-
Click Back to Reports List to go back to the Reports dashboard.
Artifact Distribution Chart (Single Tracker)
This chart comes in handy if you want to report the status of artifacts belonging to a specific tracker.
-
Click REPORTS from the Project Home menu.
-
Click Create in the List Reports page. The Select Report Type page appears.
-
Select Artifact Distribution Chart (Single Tracker) from Distribution Reports.
-
Type a report title and description.
-
Select a tracker from the SELECT TRACKER(S) drop-down list.

-
Select one or more planning folders (select the check boxes) from the SELECT PLANNING FOLDER(S) drop-down list.
-
Select one of the options from the DISTRIBUTE BY drop-down list.
-
Select one of the options from the OPEN VS CLOSE drop-down list.
-
Leave the CHART DISPLAY TYPE as Pie, which is the only available chart type for this report.
-
Select report visibility:
PublicorPrivate. -
Click Preview.
-
Click Create. The report is created and the View Report page appears.
Print or download charts
You can print charts or download them as .PNG, .JPG, .SVG or .PDF files using the print/download quick function icon.
-
Click Back to Reports List to go back to the Reports dashboard.
Trend Reports
Here's a list of reports to know some artifact trend data.
Average Age Report
The average age chart lets you know the average age of artifacts in one or more trackers you select.
You can:
-
Generate this report to know the average age of artifacts in various units of time such as number of hours, days or weeks.
-
Group this report either by artifact priority such as P1, P2 and so on or by both artifact priority and category.
-
Generate this report for either open or closed artifacts.
-
Exclude weekends from being included in the average age calculation.
-
Click REPORTS from the Project Home menu.
-
Click Create in the List Reports page. The Select Report Type page appears.
-
Select Average Age Report from Trend Reports.
-
Type a report title and description.
-
Select one or more trackers from the SELECT TRACKER(S) drop-down list.

-
Select a planning folder from the SELECT PLANNING FOLDER(S) drop-down list.
-
Select one of the time units such as hours, days or weeks from the AVG. TIME IN drop-down list.
-
Select either Priority or Priority & Category from the GROUP BY drop-down list.
-
If required, select EXCLUDE Weekends check box to exclude weekends from being included in the average age calculation.
-
Select either
Open OnlyorClosedfrom the OPEN VS. CLOSE drop-down list. -
Leave the CHART DISPLAY TYPE as Stackedcolumns, which is the only available chart type for this report.
-
Select report visibility:
PublicorPrivate. -
Click Preview.
-
Click Create. The report is created and the View Report page appears.
Print or download charts
You can print charts or download them as .PNG, .JPG, .SVG or .PDF files using the print/download quick function icon.
-
Click Back to Reports List to go back to the Reports dashboard.
Artifact Open/Close Chart (Multiple Trackers)
Use this chart to know the number of opened and closed artifacts over a period of time across one or more trackers or planning folders. This chart also helps in knowing the number of associated commits in specific repositories over a period of time. You can also know the total number of open artifacts through this chart.

The number of opened and closed artifacts, and the number of associated commits are shown as color-coded bars (scale on left Y coordinate axis) and the total number of open artifacts is shown as a color-coded line (scale on right Y coordinate axis). The X coordinate axis shows the time scale of the chart.
At least one of the reporting parameters such as the Tracker ID, Planning Folder ID or the Repository ID is required to generate this chart. The following table lists the various reporting parameters for Artifact - Open/Close Chart (Multiple Trackers).
-
Click REPORTS from the Project Home menu.
-
Click Create in the List Reports page. The Select Report Type page appears.
-
Select Artifact Open/Close Chart (Multiple Trackers) from Trend Reports.
-
Type a report title and description.
-
Select one or more trackers from the SELECT TRACKER(S) drop-down list.

-
Select one or more planning folders (select the check boxes) from the SELECT PLANNING FOLDER(S) drop-down list.
-
Select one or more repositories from the SELECT REPOSITORY(S) drop-down list.
-
Select one or more artifact priorities. For example, select P1 and P2 to include P1 and P2 artifacts in your chart. Select the None to include artifacts that have no priority assigned to them.
-
Select one of the report durations: Last Week/Last Month/Last Quarter/Last Year`.
-
Leave the CHART DISPLAY TYPE as Dualaxeslinecolumn, which is the only available chart type for this report.
-
Select report visibility:
PublicorPrivate. -
Click Preview.
-
Click Create. The report is created and the View Report page appears.
Print or download charts
You can print charts or download them as .PNG, .JPG, .SVG or .PDF files using the print/download quick function icon.
-
Click Back to Reports List to go back to the Reports dashboard.
Table Reports: Task and Tracker Reports
These are reports on trackers and tasks in a tabular format.
-
Task reports - Task reports display selected summary data about project tasks. You can generate reports on the tasks in a selected project or across multiple projects.
-
Click REPORTS from the Project Home menu.
-
Click Create in the List Reports page. The Select Report Type page appears.
-
Select Task from Table Reports.
-
Title and Description - Type a title and description for your report.
-
Project(s) - Select the project or projects from which you want task data to be reported.
-
Status(s) - Select the status of the tasks to be included in your report.
-
Priority(s): Select one or more priorities of tasks to be included in your report.
-
Select one or more Assigned To or Submitted By project members. Click the '+' icon to add members.

-
Start Date and End Date - Select the start and end date ranges of tasks to be included in your report.
-
Report Field(s) - Select the fields you want displayed in your report.
-
Select one of the report visibility options:
Public(default) orPrivate. -
Click Create. The View Report page appears. The task report is created.
-
-
Tracker reports - Tracker reports give you a summary of the history of tracker artifacts. A tracker report can cover the tracker artifacts in a selected tracker or across all trackers in a project.
-
Click REPORTS in the project navigation bar.
-
Click Create in the List Reports page. The Select Report Type page appears.
-
Select Tracker from Table Reports.
-
To create a tracker report across multiple projects, click Show All Projects and select the trackers from the required projects.
-
Title and Description - Type a title and description for your report.
-
Select Tracker(s) - Select the trackers from which you want tracker artifact data to be reported. Group By: Have the report grouped by one of the following: Assigned To, Category, Customer, Group, Priority, Status or Team.
-
Summary Statistics - Select one of the following statistics to summarize the report: Count of Artifacts, Sum of Points or Sum of Effort.
-
Priority(s) - Select one or more priorities of artifacts to be included in your report.
-
Select Artifact Maturity(s) - Select one or all of the following values to have all or new or modified artifacts included in the report respectively:
AnyorNeworEdited. -
Select date ranges for create date (Submitted On), last edited date (Last Modified), or closed date (Closed).
-
Select one or more Assigned To or Submitted By project members. Click the '+' icon to add members.

-
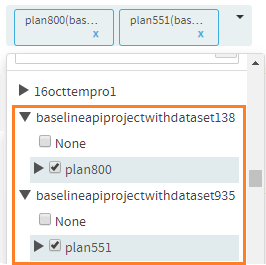
Select one ore more planning folders from the Select Planning Folder(s) drop-down list.
From TeamForge 19.3, you can select one or more planning folders within current project and across projects.
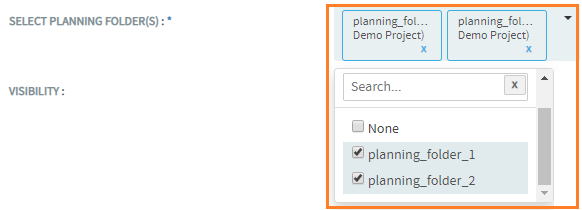
To select multiple planning folders from other projects:
-
Click Select Planning Folder(s) drop-down list.
-
Click Show All Projects toggle field.
 note
noteThe Show All Projects toggle field changes to Show Current Project, which on clicking takes you back to the list of planning folders in current project.
-
Click to expand the project and select the required planning folders.
-
-
Select one of the report visibility options:
Public(default) orPrivate. -
Click Next. A list of filters (such as category, status, reported in release, fixed in release and so on) for the selected trackers are shown. Select the filter values from the drop-down lists and click Create. Based on the criteria being selected for filtering, it returns the configured rows.
The View Report page appears. The default value of the token MAX_REPORT_ROWS is set to '300' in
site-options.conffile. For trackers with more than 300 artifacts, the tracker report is generated based on the criteria:-
If you have selected a single tracker having more than 300 artifacts, the tracker report shows only the first 300 artifacts. To see all the artifacts in that tracker, click the Export button.
-
If you have selected multiple trackers with more than 300 artifacts in all, then the tracker report shows the artifacts based on the following calculation:
No. of artifacts in report = MAX_REPORT_ROWS ÷ No. of selected trackers
For example, if you have selected 3 trackers with more than 300 artifacts in all, the first 100 artifacts is displayed in the tracker report for each tracker. You can export the report for each tracker to view all the artifacts in it.
importantIn a tracker report, when you select more than one value from a multi-select, user-defined field as filter and if an artifact is associated with all of the selected values, then that artifact's record is duplicated for each of the selected values.
For example, assume that you have a 'Select User' multi-select, user-defined field with values 'User 1', 'User 2' and 'User 3' in a tracker report. All these three values are associated with 'artifact 1001'. Select all three values as filter and generate the tracker report. You will see 'artifact 1001' record being duplicated, that is, you will see three individual 'artifact 1001' records created for each of the three users.
-
-