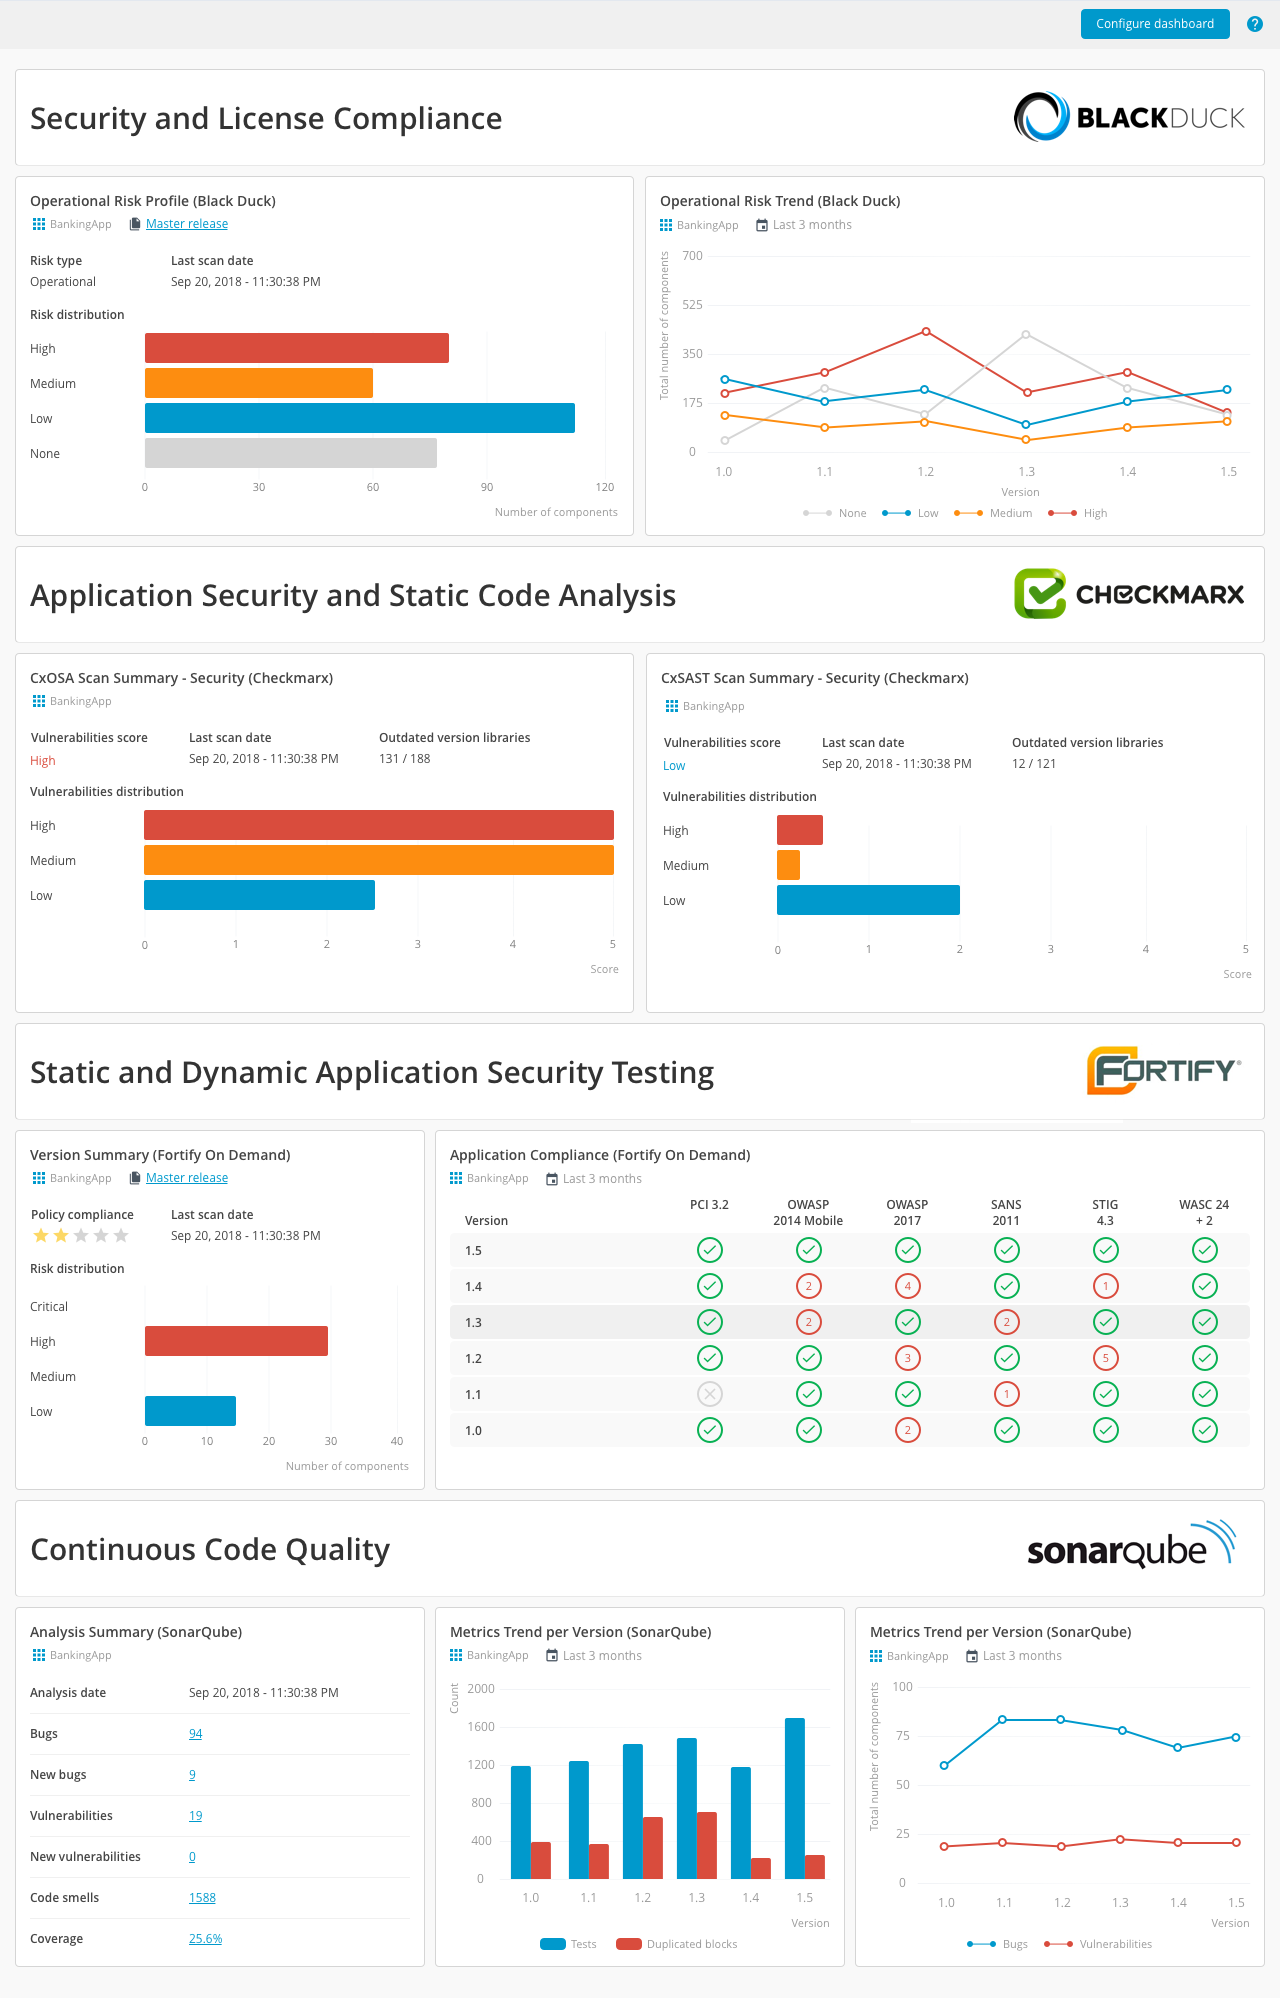
Code Compliance and Security Dashboard
In Release 8.5 and later, you can use custom dashboards to build a security and compliance dashboard to ensure that your applications meet the compliance requirements and to help you identify applications that are failing to meet security standards. For more information about custom dashboards, see Configure custom dashboards.
Create the dashboard
To create the code compliance and security dashboard:
- From the navigation pane, under Reports, click Dashboards.
- From the navigation pane, click Add custom dashboard.
- Hover over a blank template and click Select.
- In the Name field, add a unique name for the dashboard.
- In the Columns field, define the number of columns that will be used in the dashboard grid.
- In the Dashboard owner field, define which user or user group owns the dashboard.
note
A dashboard owner has modify and delete permissions. A dashboard can be assigned to one owner only.
- In the Viewers field, define which users or user roles can view the dashboard.
- In the Editors field, define which users or user roles can edit the dashboard.
- Click Save.
Add code compliance and security tiles
To add a tile to the dashboard:
- Click Add tiles.
- Search for one of the code compliance and security tiles.
- Select the tile and click Add.
The list of available code compliance and security tiles:
- The SonarQube analysis summary and SonarQube metrics trend per version tiles. For more information, see Using the Release SonarQube plugin.
- The Fortify on Demand version summary and Fortify on Demand application compliance tiles. For more information, see Using the Release Fortify on Demand plugin.
- The Fortify SSC version summary and Fortify SSC compliance tiles. For more information, see Using the Release Fortify SSC plugin.
- The CxOSA Scan Summary and CxSAST Scan Summary tiles. For more information, see Using the Release Checkmarx plugin.
- The Black Duck risk profile and Black Duck risk trend tiles. For more information, see Using the Release Black Duck plugin.
