Story Summary Dashboard Panel
This article explains how to use the Story Summary Dashboard Panel in Agility.
Overview
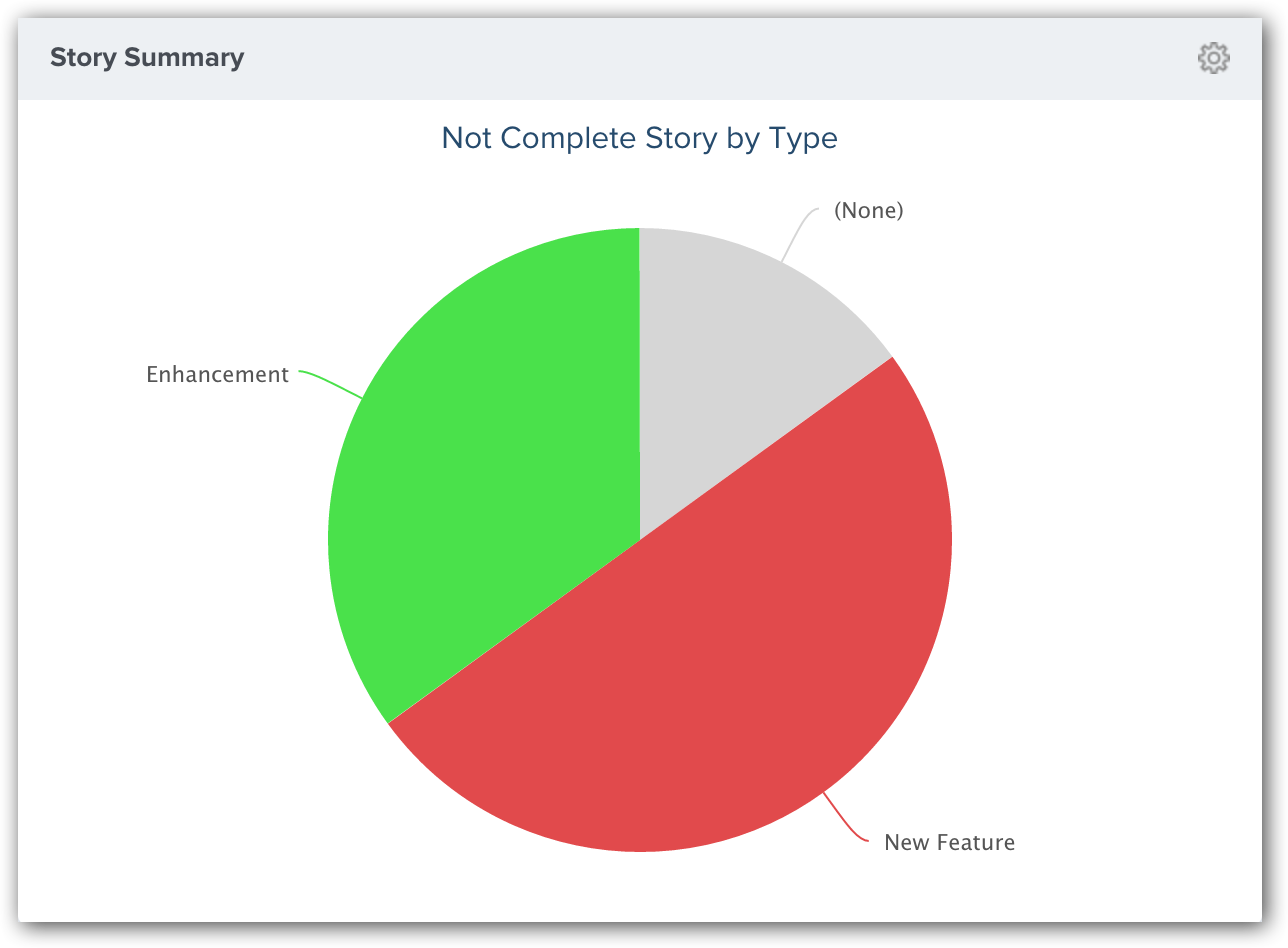
The Analytics Story Summary dashboard panel contains a pie chart showing a summary of stories. By default, the pie chart shows open stories grouped by type. However, additionally, you can change the grouping and story state options in the panel parameters. The grouping options allow you to group the pie chart by Defect Type, Source, Priority, Status, or Complexity (aka Risk). Using the Story State option, you can choose to show All Stories, Open Stories, or Closed Stories.

Configuring the Panel
- To configure the panel, click on the gear icon
at the top-right corner and click Edit.
- Choose from the panel parameters below.
Parameters for this panel may differ depending on the location of the dashboard.
Where to Find This Panel
This panel is available on any of the following Analytics dashboards:
- Portfolio > Executive Dashboard
- Program > Dashboard
- Program > Product Owner Dashboard
- Team > Dashboard
- Team > Team Dashboard
- Team > Quality Dashboard
- Team > ScrumMaster Dashboard
If the panel is not visible, you can add it following the instructions in Adding a Panel to a Dashboard.