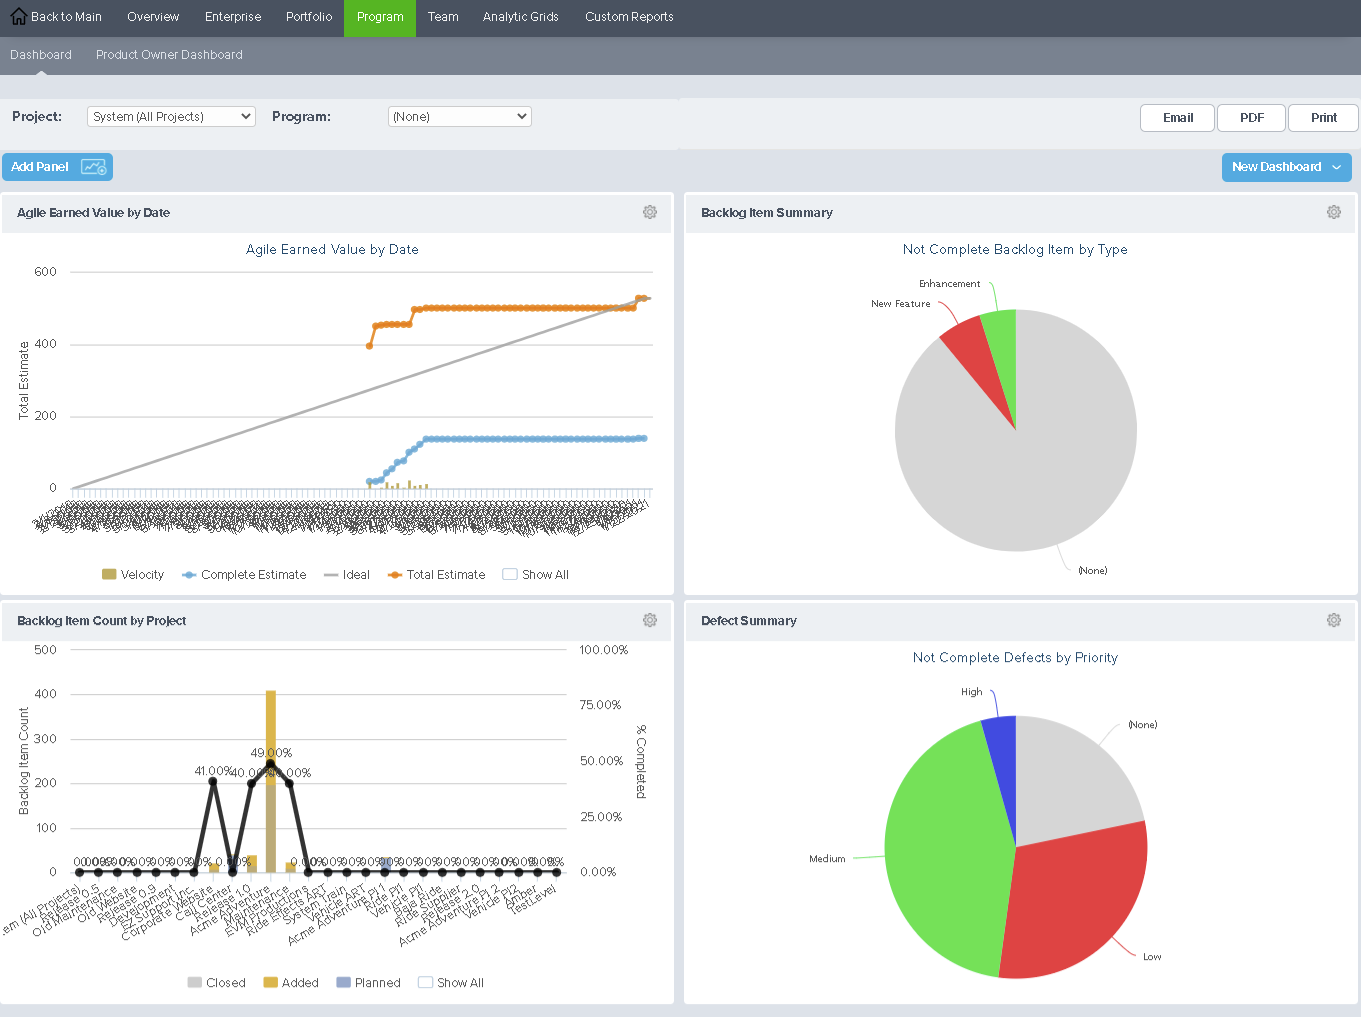
Analytics Program or Release Dashboards
The Analytics Program dashboards provide reporting at the Program (or Release) level is focused on tracking features across one or more products or releases.
On the Program Dashboard tab, you will see a set of pre-populated panels that highlight key metrics at the project or program level.
Note that each dashboard is completely flexible so you can customize it by adding, removing, and rearranging panels the way you want to see them.

Accessing the Program Dashboards
- Click the hamburger menu
> Analytics.
- Click on the Program tab and click on the Program Dashboard tab.
The Program Dashboard contains global parameters and panels targeted at any level to highlight pertinent project metrics at each level or perspective.
- Agile Earned Value by Date Dashboard Panel
- Analytics Custom Reports
- Defect Trend by Project Dashboard Panel
- Detail Estimate Trend Dashboard Panel
- Effort Trend Dashboard Panel
- Issue Summary Dashboard Panel
- Issue Trend Dashboard Panel
- Portfolio Item Burn Up Dashboard Panel
- Portfolio Item Burn Up Monte Carlo Simulation Dashboard Panel
- Portfolio Item Cycle Time Dashboard Panel
- Portfolio Item Progress Report Dashboard Panel
- Portfolio Item Test Trend Dashboard Panel
- Portfolio Item Time in Status Dashboard Panel
- Portfolio Item Time in Status Histogram Dashboard Panel
- Project Burndown Dashboard Panel
- Project Burndown Monte Carlo Simulation Dashboard Panel
- Regression Test Trend Dashboard Panel
- Request Summary Dashboard Panel
- Request Trend Dashboard Panel
- Story Count by Project Dashboard Panel