Black Duck Plugin
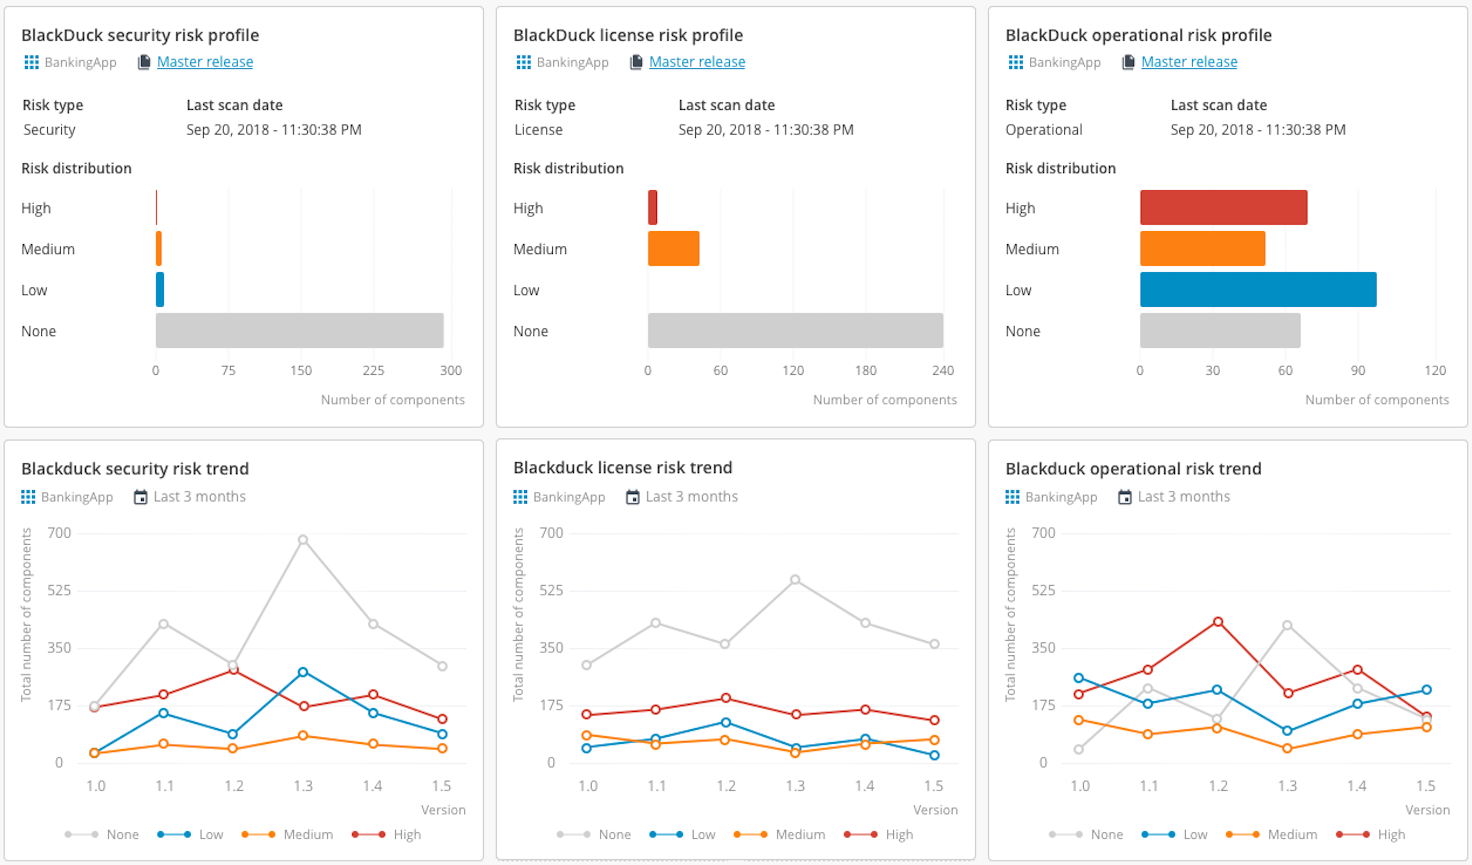
The plugin provides summary tiles for the Black Duck Hub that displays the counts of each component with various risks and severities.
In the Digital.ai Release Black Duck plugin, you can monitor various risks as analyzed by Black Duck, and to take action in Digital.ai Release. For example, to fail or pass a release based on the severity and volume of risks in Black Duck.
A gate task is included in the plugin. This is used to configure various thresholds which determine if the task pass or fails.
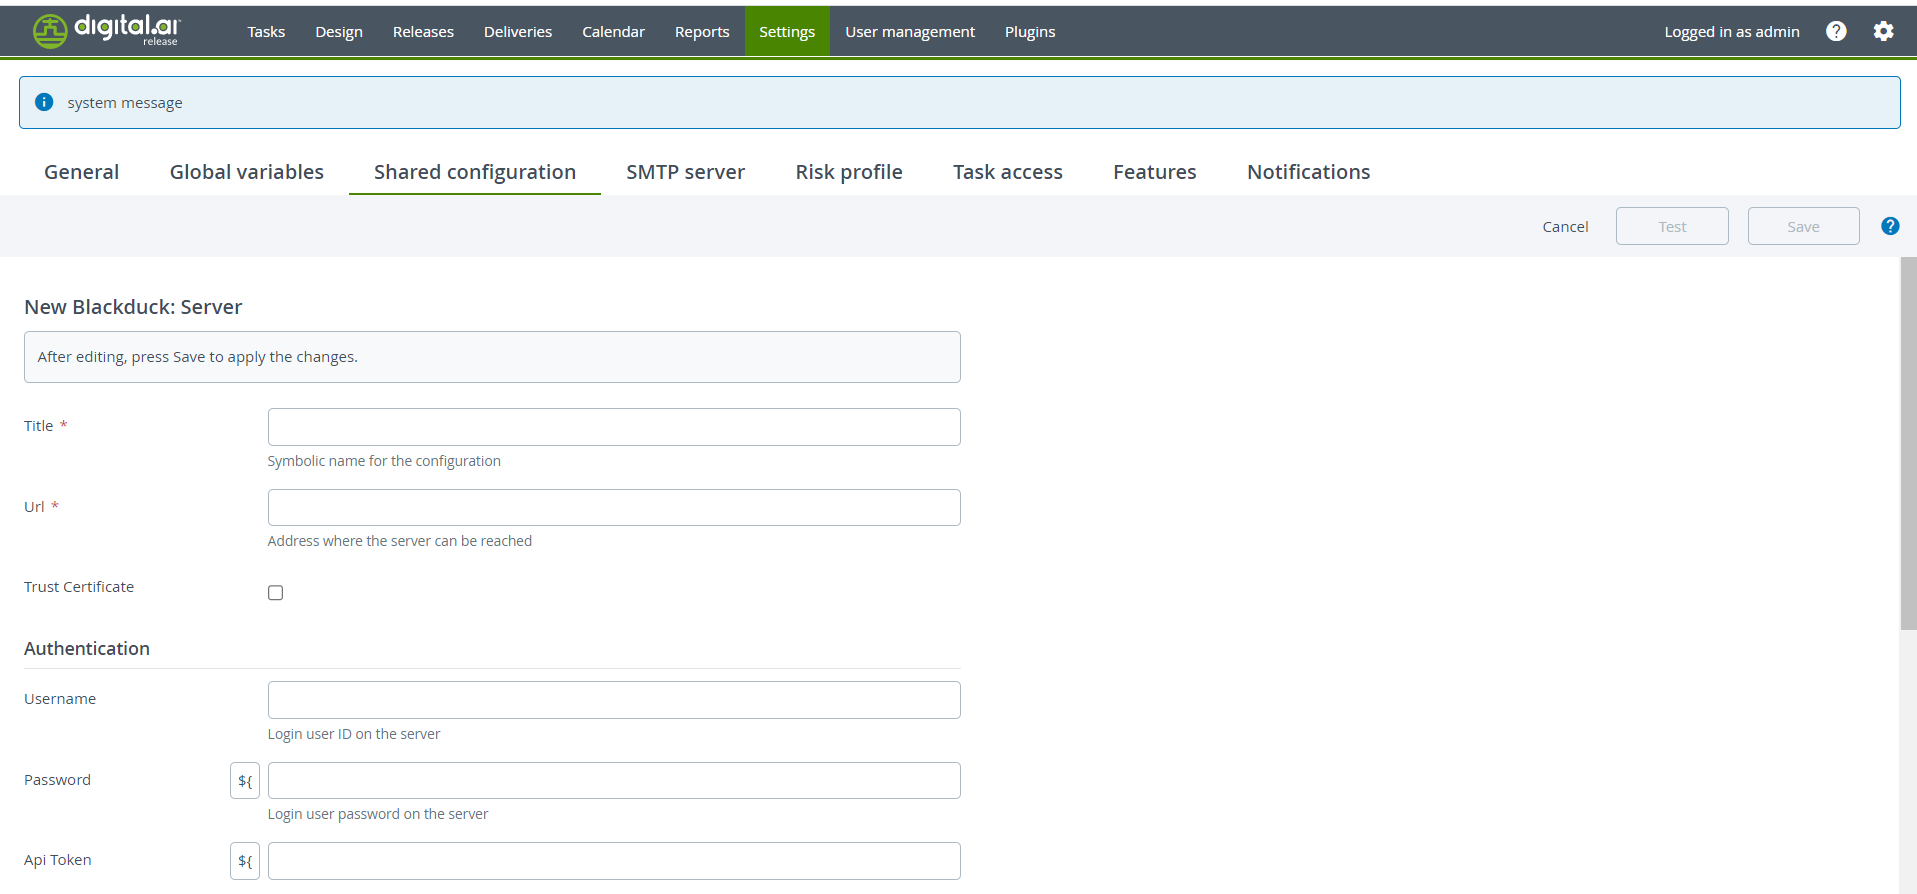
You must set up a connection to Black Duck server before adding Black Duck tasks or tiles. For information, see Define a Black Duck Server section on this page.
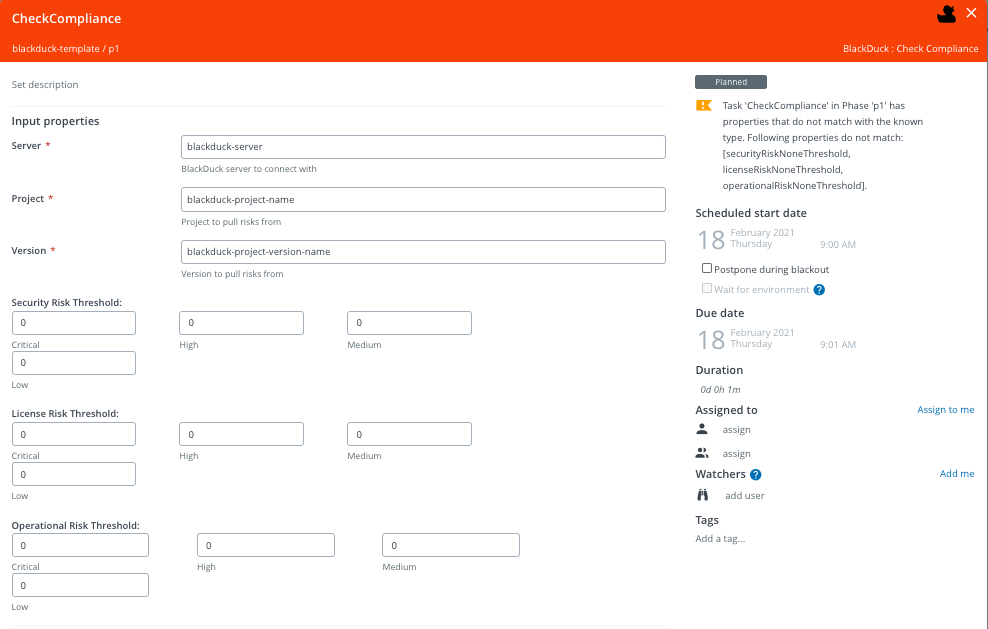
In the release flow editor, the Black Duck Check Compliance task has a red border.
Features
The plugin added to Digital.ai Release provides:
- A Black Duck Server type that can be used to configure the host running the Black Duck Hub.
- A Black Duck Check Compliance task.
- A summary tile for the Black Duck Risk Profile.
- A summary tile for the Black Duck Risk Trend.
Requirements
The plugin requires the following:
- The Black Duck Hub server running and accessible via HTTP(S).
- The scan results available on the Black Duck Hub server.
Define a Black Duck Server
There are two locations where you can define a Black Duck: Server configuration:
- On a global level in Connections under the Configuration group of the navigation pane
- On a folder level in Overview > Folders of the navigation pane, under the Configuration tab of the desired folder
To set up a connection to a Black Duck Hub Server, do the following steps:
- In Digital.ai Release, go to one of the two specified locations.
- Click
next to the Black Duck: Server.
- In the Title field, specify a name for your Black Duck server.
- In the URL field, specify the URL where to connect to the Black Duck server.
- To trust all SSL certificates exposed by the server, check the Trust Certificate checkbox.
- In the Username and Password fields, specify the login username and password of the user on the server.
Authentication using API token is supported
 7. If you are using a proxy connection, specify the host, port, username, password, and NTLM domain authentication in the Proxy section.
 8. To test the server connection, click Test.
9. Click on Save.
After the server connection is set up, you can create a release or template that checks thresholds of various risks according to the Black Duck Hub.
Check Compliance Task
The Check Compliance task creates a gate in the release flow which can break the flow if the count of components of various risks are greater than the configured thresholds.
In the new release, add a task of type Black Duck > Check Compliance.
- Select the Black Duck server where the results are stored.
- Specify the Project Name and the Project Version.
- Configure the thresholds for each type of risk for each severity. Each threshold sets the maximum allowed count of components for that risk and severity.

Black Duck Risk Profile Tile
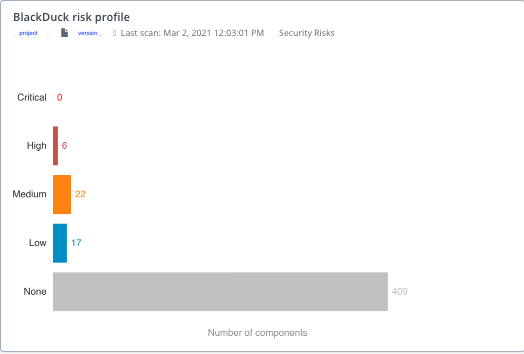
The Black Duck Risk Profile tile shows a summary of a risk type displayed as a graph, for example: Security Risk, License Risk, or Operational Risk.
The graph shows the number of components categorized according to severity for the configured risk type.
To configure the Black Duck Risk Profile tile, do the following steps:
- In the top navigation bar, click on Dashboards.
- Select the dashboard where you want to add the new tile.
If you have not created a dashboard yet, to create dashboard, click on the Add dashboard button on the top right of the screen.
- On the top right of the screen, click Configure dashboard.
- On the top right of the screen, click Add tiles.
- Hover over Black Duck risk profile and click on Add.
- On the dashboard, hover over the new Black Duck risk profile tile and click
.
- In the Title field, enter the name for the tile.
- In the Server field, enter the name of the Black Duck server to connect with.
- In the Project field, enter the project to pull data from.
- In the Version field, select a version to display metrics on.
- In the Risk type field, select a risk type to display.
Version filters follow semantic versioning. A custom regex can also be used, provided that it is python compatible.
- Click on Save.

Black Duck Risk trend tile
The Black Duck Risk trend tile shows a summary of a risk type, displayed as a graph, over a set period of time. For example: Security Risk, License Risk, or Operational Risk.
To add a Black Duck Risk trend tile, do the following steps:
- In the top navigation bar, click Dashboards.
- Select the dashboard where you want to add the new tile.
If you have not created a dashboard yet, to create the dashboard, click on the Add dashboard button on the top right of the screen.
- On the top right of the screen, click on Configure dashboard.
- On the top right of the screen, click on Add tiles.
- Hover over Black Duck risk trend and click on Add.
- On the dashboard, hover over the new Black Duck risk trend tile and click
.
- In the Title field, enter the name for the tile.
- In the Server field, enter the name of the Black Duck server to connect with.
- In the Time period field, select the period of time to display.
- In the Project name field, enter the project to pull data from.
- In the Risk type field, select a risk type to display.
- In the Versions field, select the versions to display metrics on.
Version filters follow semantic versioning. A custom regex can also be used, provided that it is python compatible.
- Click on Save.
