Creating a Bubble Chart
A bubble chart requires at least one attribute and one metric. The markers are not sized and do not overlap.
- Open a dashboard.
- In the top toolbar, click Visualization
 .
. - Choose More > Bubble Chart
 .
. - In the Datasets panel, double-click attributes and metrics to add them to the visualization.
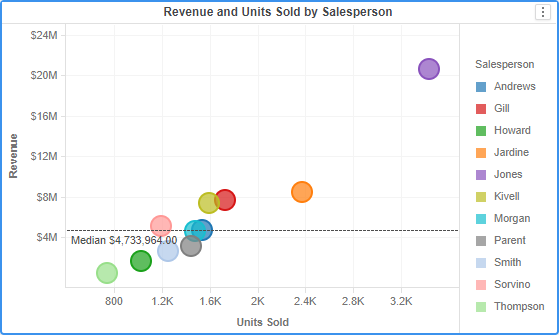
Example Bubble Chart