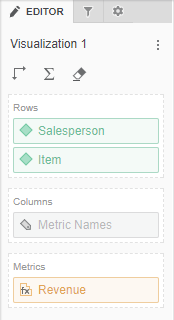
Editor Panel
The Editor panel contains a list of all the attributes and metrics that appear as data in the selected visualization. To view the dataset objects for a specific visualization, click the visualization in the dashboard.
Access
- Open an existing dashboard that contains the visualization you want to edit.
- Select the visualization in the dashboard.
- Click View and then select Editor Panel.
- To add data to your visualization, drag attributes or metrics from the Datasets panel to the Editor panel. A blue indicator line appears in the area to which you add the attribute or metric.