What is a Dashboard?
A dashboard is a visual representation of data that presents the data in a summarized format, making it easier to monitor trends and track performance at a glance. It provides a quick overview of KPIs, metrics, and other relevant information to help you make informed decisions.
Out-of-the-box dashboard
An out-of-the-box dashboard is a pre-built or ready-to-use dashboard that comes with your product. These dashboards provide you with immediate access to key metrics, visualizations, and insights without requiring extensive customization. These dashboards are typically built using best practices and industry standards, incorporating commonly used metrics and visualizations.
Custom dashboard
You can copy an out-of-the-box dashboard and customize it based on your requirements and preferences. It offers flexibility and customization, allowing you to choose the metrics, visualizations, and layouts that best suit your needs.
Dashboard components
A dashboard has the following key components and sections:
- KPIs: Displays important metrics that represent the performance of the system or the process. Here is an example KPI.
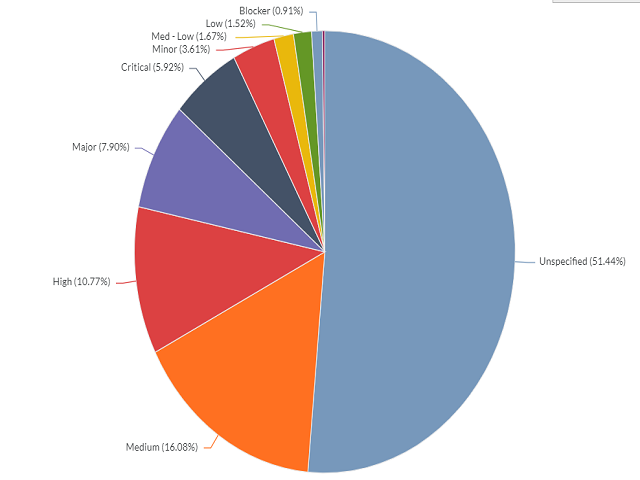
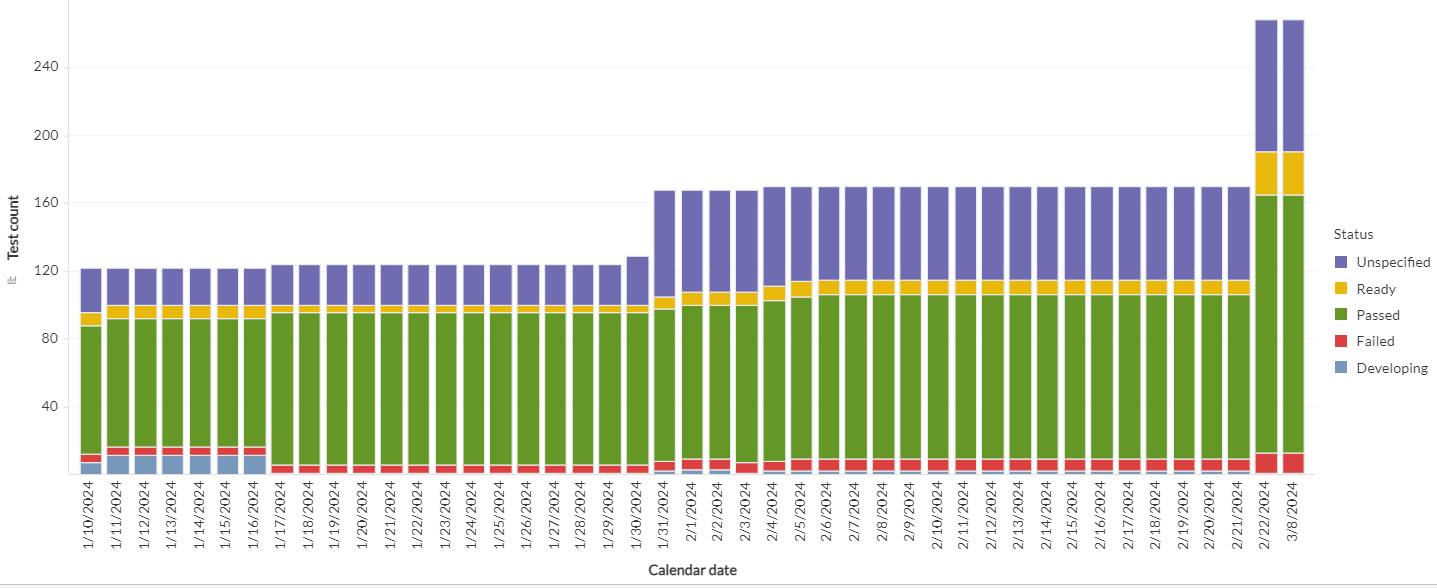
- Panel: It refers to a container or a section within the dashboard layout where visualizations, widgets, or other dashboard elements are placed. You can use the panel to visualize various aspects of your data, such as KPIs, trends, comparisons, or detailed reports. You can use the panel as a chart or grid. The chart is a graphical representation of data that conveys trends, patterns, and insights. The chart types are bar, line, pie, scatter plot, and heatmap. Grid is a tabular representation of data, organized in rows and columns. Here is an example panel.

Here is an example chart.

Here is an example grid.

- Tab: It refers to a navigational element that allows you to switch between different sections or views within the dashboard. You can use tabs to view multiple sets of related content or analyses in a single dashboard. Here is an example tab.
- Filter: Filters in a dashboard serve as a tool to selectively control the data presented in visualizations and other dashboard elements. You can refine your analysis by setting specific criteria or conditions that the data must meet. Each filter allows you to focus on different aspects of the data, enabling comparisons across panels based on various parameters. Additionally, cascading filters enhance usability by dynamically adjusting the filter values based on the selection made in a dashboard. For example, selecting a value in one filter triggers other filters to display related values, facilitating a more streamlined and targeted analysis process. Here is an example filter.
- Chapter: Chapters provide a hierarchical structure for organizing the content of the dashboard. They help break down large amounts of information into smaller, more manageable sections. Each chapter typically focuses on a specific topic, analysis, or set of data. This segmentation allows users to navigate directly to the sections that are most relevant to their interests or needs.
- Dataset: It refers to a collection of data organized and stored together. Data stored in a structured format in the form of a table related to a specific domain or business process is a dataset. Each dataset contains rows and columns of data, where each row represents a record, and each column represents a data attribute or field.
- Attribute: It refers to a characteristic or property of an entity or object. Attributes provide descriptive information about the entity and are stored in database tables or datasets as columns.
- Metric: It refers to a quantitative measure or indicator used to assess, analyze, and track the performance or behavior of a business process, system, or activity. Metric helps you measure various aspects of your organization's operations. You can make informed decisions and evaluate success in achieving specific objectives.
Here is an example attribute and metric.
You can perform other tasks like exporting and duplicating in a dashboard.
Exporting a dashboard
Exporting a dashboard allows you to view the dashboard outside your product. For example, you can view the dashboard results in a PDF file within Adobe Reader for viewing or printing. You can export a dashboard to the following formats:
- PDF file
- Excel spreadsheet
You can use the exported dashboard for the following purposes:
- Further analysis: Exported data enables advanced analysis using tools like Excel, R, or Python for tasks like statistical analysis, predictive modeling, or data mining.
- Reporting: Exported data allows for customized reports to meet stakeholder needs, with formatting and insights tailored accordingly.
- Data sharing: Exported data facilitates collaboration and decision-making by enabling sharing with stakeholders who lack dashboard access or prefer offline work.
You can export a dashboard by selecting a grid or panel visualization and then clicking Export from the three-dot menu.
Duplicating a dashboard
You can create a new dashboard by duplicating an existing dashboard and then modifying it. Duplicating a dashboard allows you to quickly and easily create a new version of an existing dashboard without having to recreate it from scratch. You can use the duplicated dashboard for the following purposes:
- Backup and versioning: Duplicating data serves as a backup for protection against loss or corruption and enables versioning for comparison and experimentation.
- Data manipulation: Duplicating data allows experimentation with various manipulations without altering the original dataset, facilitating analysis before permanent modifications.
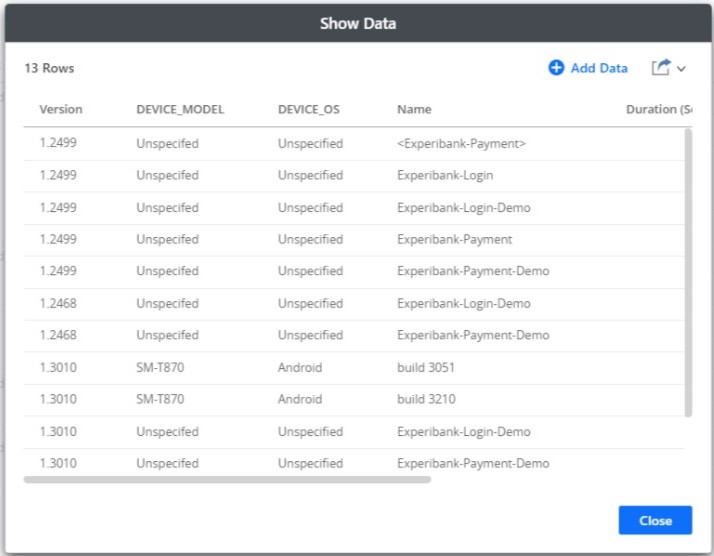
Previewing data
The Show Data dialog box in a dashboard enables you view the underlying attribute and metric data of a visualization in an easy-to-read grid format. You can can preview data by selecting a grid or panel visualization and then clicking Show Data from the three-dot menu. Here is an example preview data.
