Using Deploy reports
Deploy contains information about your applications, environments, infrastructure, and deployments. Using the reporting functionality, you can gain insight into the state of your environments and applications.
Reports dashboard
When opening the Reports section for the first time, Deploy will show a high-level overview of your deployment activity.
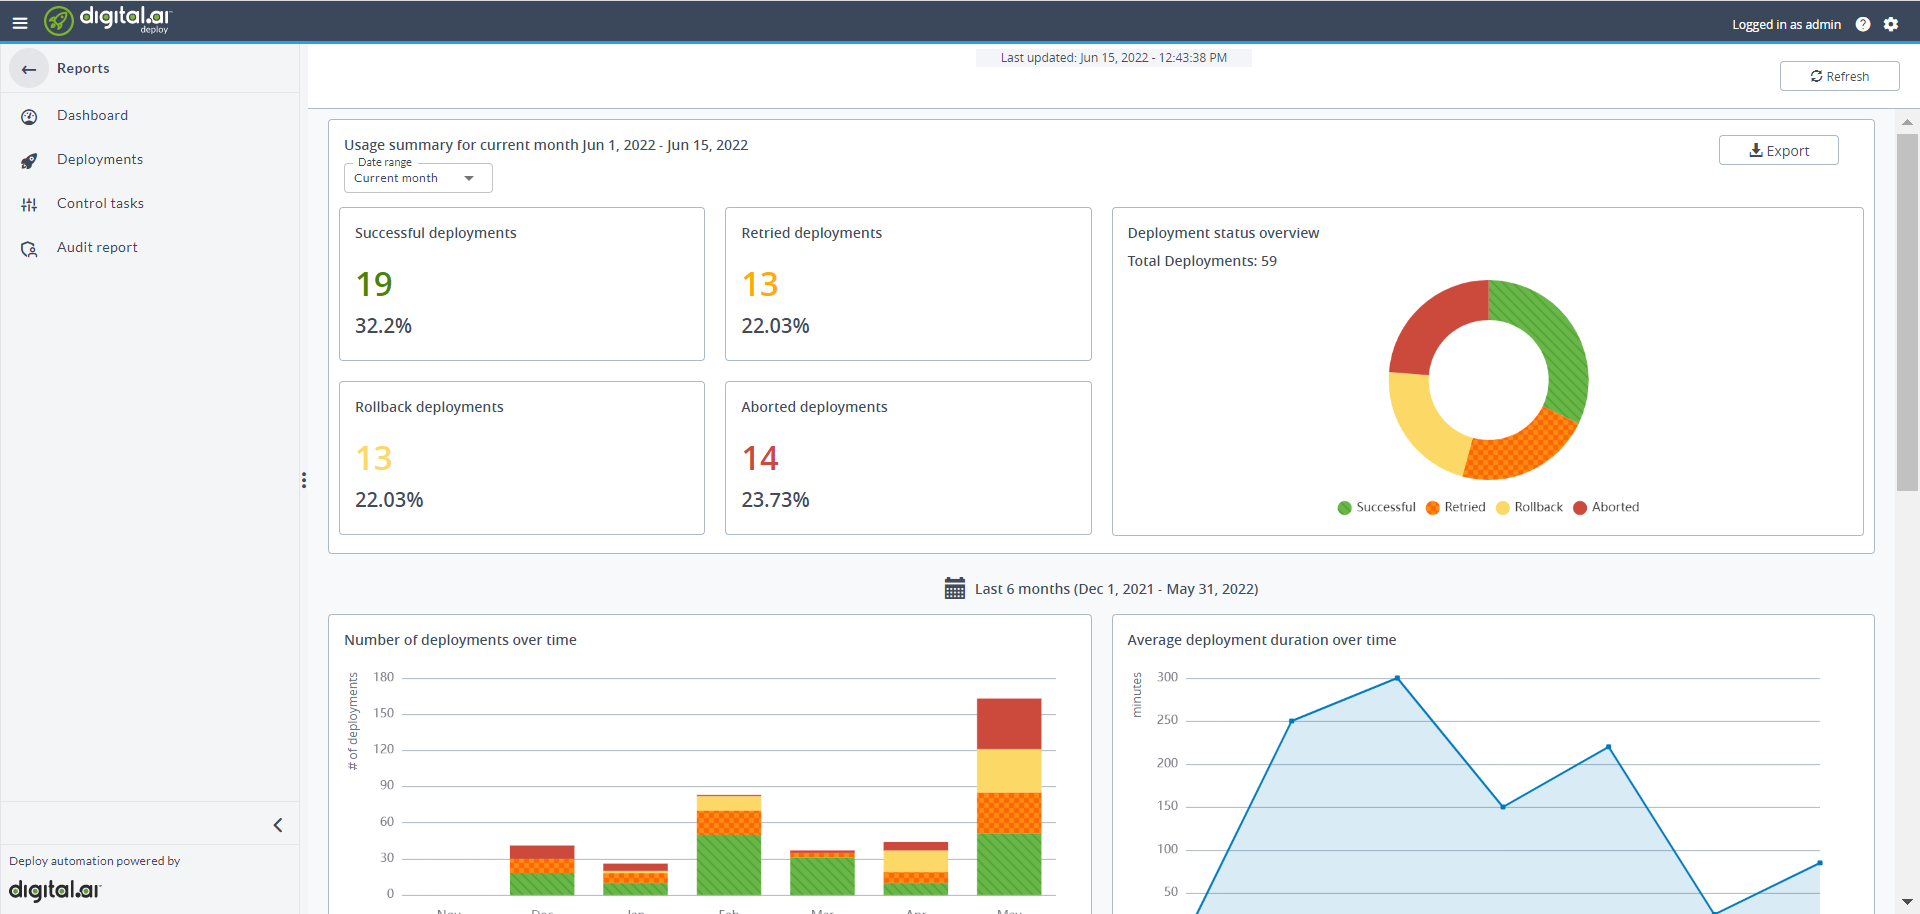
The dashboard consists of three sections that each give a different view of your deployment history:
| Section | Description |
|---|---|
| Current Month | Information about the current month. Provides insight into current deployment conditions: the percentage of successful, retried, rollback, and aborted deployments. |
| Last 6 Months | Trend information about the last 6 complete months. |
| Last 30 Days | Information about the past 30 days of deployments. |
The following graphs display on the dashboard:
| Graph | Description |
|---|---|
| Deployment status overview | The percentage of successful, retried, rollback, and aborted deployments. |
| Number of deployments over time | Number of deployments divided into successful, successful with manual intervention, failed deployments, and rollbacks over the last 6 months. |
| Average deployment duration over time | Average deployment duration over the last 6 months. |
| Top 10 successful deployments | Top 10 applications with most successful deployments over the last 30 days. |
| Top 10 retried deployments | Top 10 applications with most retries, that involved manual intervention, during deployments over the last 30 days. |
| Top 10 longest deployments | Top 10 applications with longest running deployments over the last 30 days. |
Note: Rollbacks do not count towards successful deployments, even if the rollback is executed successfully.
For more information on how to download the usage summary, see Download usage reports.
To refresh the dashboard, press the refresh button in the top right corner.
Deployment report
Important: The report#view permission is required to view deployment reports. For more information, see Global permissions.
To access the deployment report: click Reports in the side navigation bar, then click Deployments.
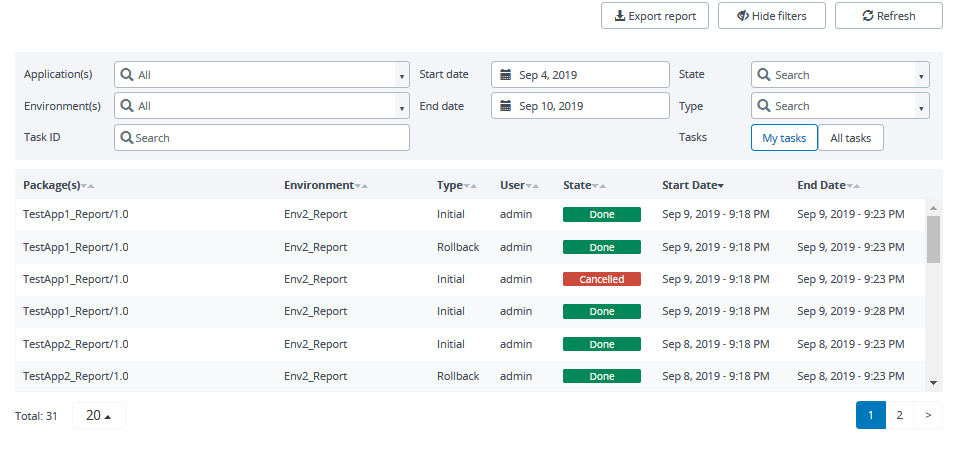
The report provides a detailed log of each completed deployment. You can see the executed plan and the logged information about each step in the plan. By default, the report shows all deployments, in the date range, in a tabular format.
The report displays the following columns:
| Column | Description |
|---|---|
| Package | The package and version that was deployed. |
| Environment | The environment to which it was deployed. |
| Type | The type of the deployment (initial, upgrade, undeployment, or rollback). |
| User | The user who performed the deployment. |
| State | The status of the deployment. |
| Start Date | The date on which the deployment was started. |
| End Date | The date on which the deployment was completed. |
To show the deployment steps and logs for that particular deployment, double-click on a row in the report.
Filtered report
You can filter the report by application, environment, task ID, date range, state and type.
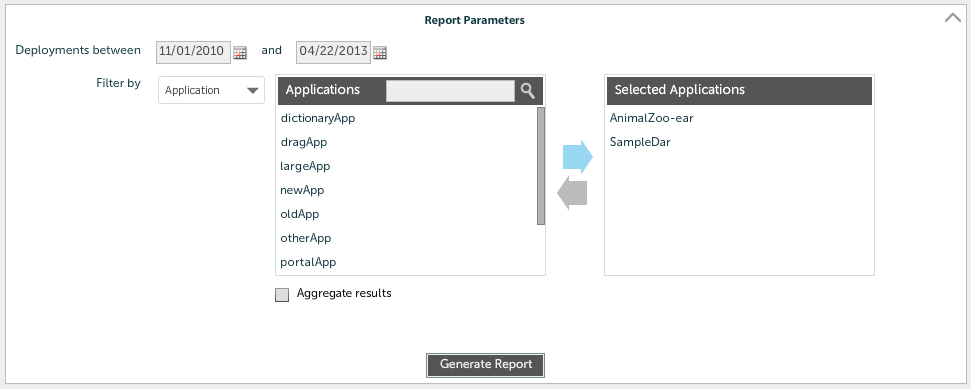
Note: If you change the name of an application or environment, you can still filter for the old name.
Exporting to CSV format
If you want to reuse data from Deploy in your own reporting, you can download report data as a CSV file by clicking .
Control task report
To access the Control task report: click Reports in the side navigation bar, then click Control tasks.
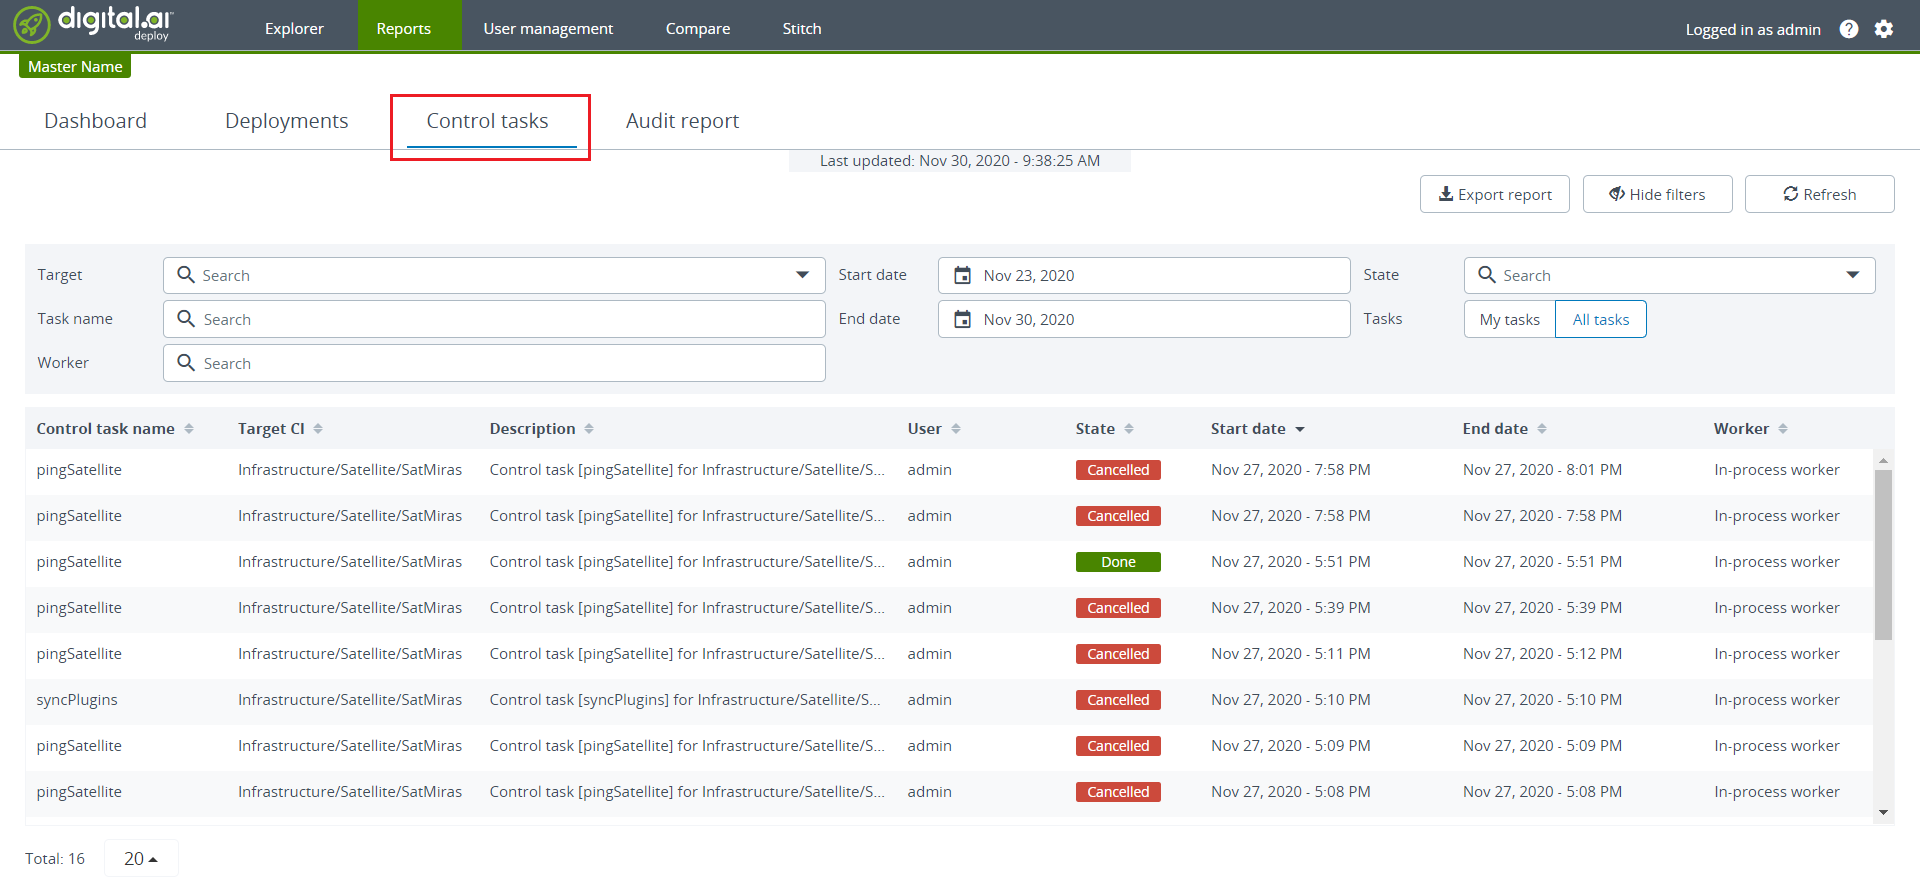
The report provides a detailed log of each completed control task. You can see the executed plan and the logged information about each step in the plan. By default, the report shows all control tasks, in the date range, in a tabular format.
The report displays the following columns:
| Column | Description |
|---|---|
| Control task name | The control task name that was deployed. |
| Target CI | The environment to which it was deployed. |
| Description | The type of the control task and its targeted CI. |
| User | The user who performed the deployment. |
| State | The status of the deployment. |
| Start Date | The date on which the deployment was started. |
| End Date | The date on which the deployment was completed. |
| Worker | The type of process worker. |
To show the deployment steps and logs for that particular control task, double-click on a row in the report.
Filtered report
You can filter the report by application, environment, task ID, date range, state and type.
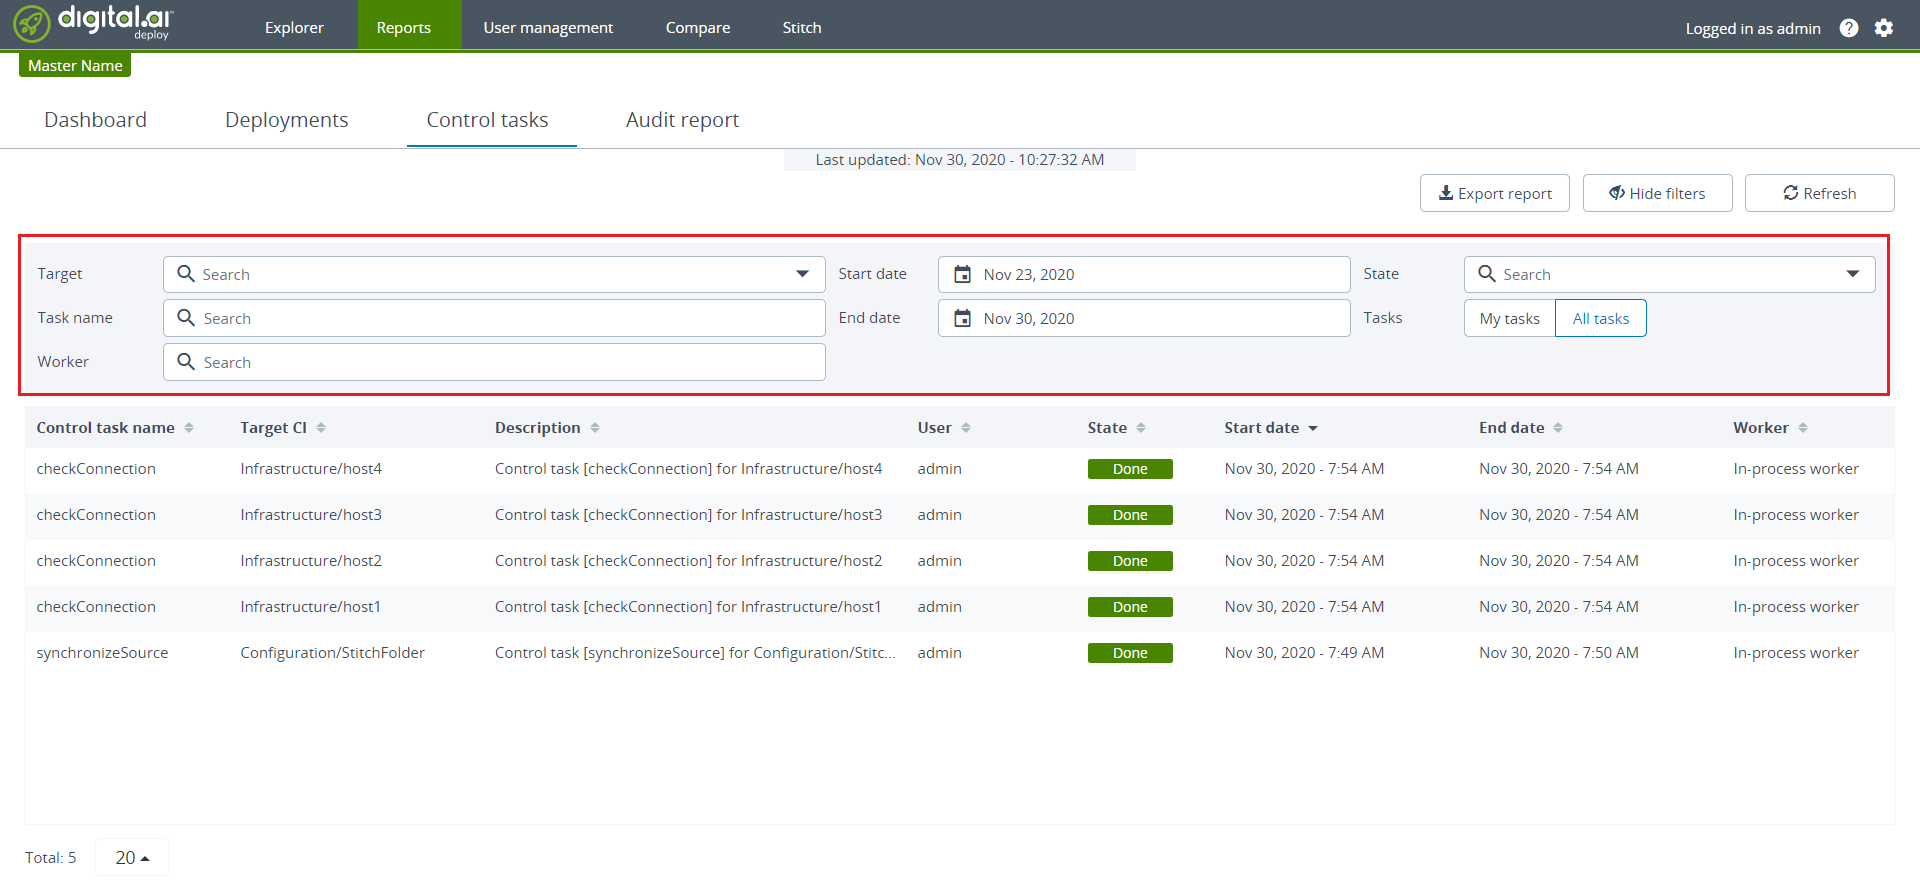
Note: If you change the name of an application or environment, you can still filter for the old name.
Exporting to CSV format
If you want to reuse data from Deploy in your own reporting, you can download report data as a CSV file by clicking .
Audit report
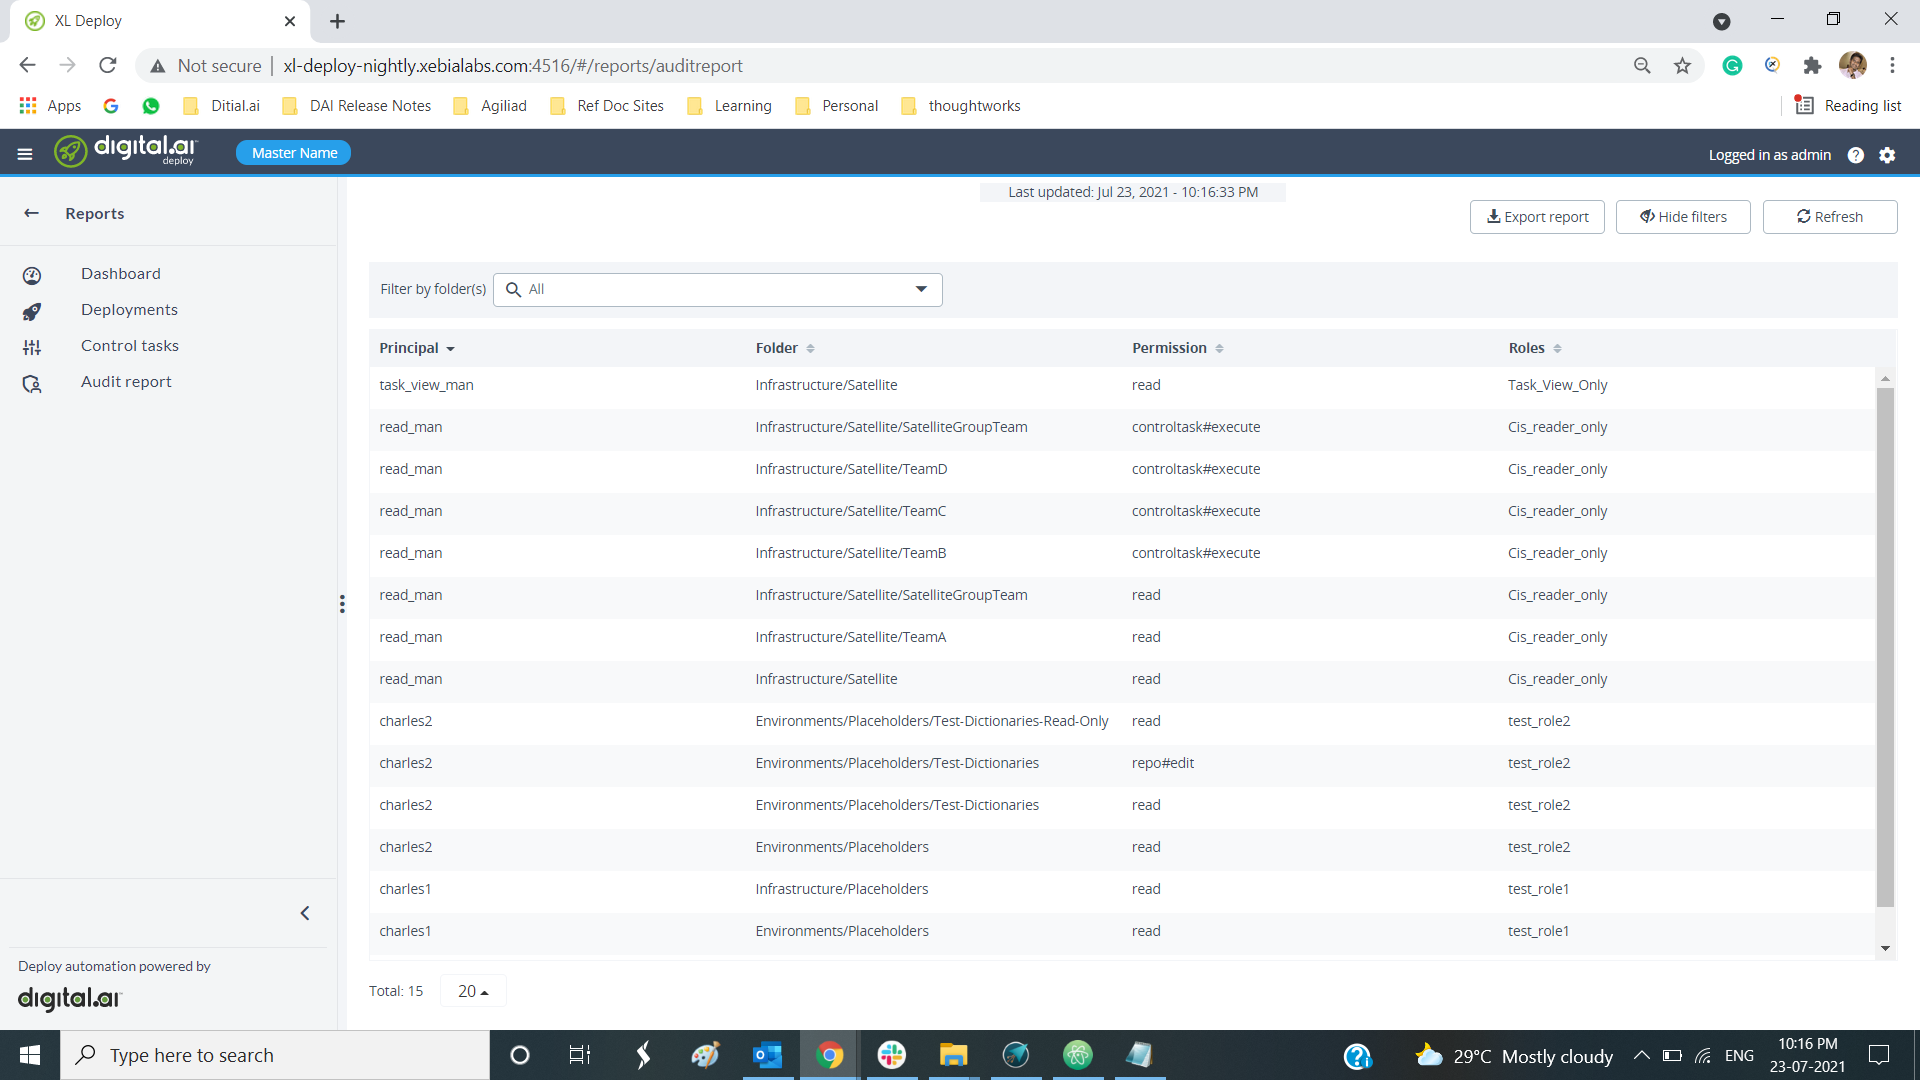
To generate the Deploy audit report, click Reports in the side navigation bar, then click Audit report. audit-report-filtered.
Filtered report
You can filter the respective application, environment, infrastructure folder(s) through search or dropdown, In the Filter by folder(s) field.
To generate/export the audit click on the .
Note: The Export report button is enabled only for the admin users.
The audit report (.xlsx format) is downloaded to your local machine.
The generated Audit report has two sheets Global and Folder.
The Global sheet displays the list of Global permissions for the user roles, with the following columns:
| Column | Description |
|---|---|
| Roles | The role of the user |
| Principals | User name or Team name |
| Permissions | The type permission the user having. Ex: View and Edit |
The Folder sheet displays the list of the application, environment and infrastructure folder(s) with the following columns:
| Column | Description |
|---|---|
| Folder | Name of the folder |
| Folder Permissions | The type permission the user having Ex: Read, Control, and execute |
| Role | The role of the user |