Performance Transactions
The Performance Transaction dashboard measures performance metrics for user flows within the application, offering comprehensive insights across various builds and devices. It consists of two pages: one for comparing device performances across multiple builds and another for highlighting differences between them. This dashboard enables easy comparison of performance metrics across different builds, helping to identify improvements, regressions, and areas that need optimization. Gain valuable insights on non-functional performance transaction tests, including CPU, memory, and network usage differentials across builds.

As a Performance Tester, you can use this dashboard to analyze the following business scenarios:
- Identify specific devices or builds in which performance lags, enabling targeted optimization efforts.
- Review the user flows are smooth and efficient across all devices and builds, enhancing overall user satisfaction.
- Identify performance regressions between builds early, allowing for timely fixes before release.
- Validate that new features or updates do not negatively impact performance.
- Compare the application performance on different devices, identifying any compatibility issues or performance discrepancies.
- Analyze performance differences between builds to ensure that each new release meets performance standards.
- Use data-driven insights to decide whether a build is ready for release based on its performance metrics.
- Allocate development resources effectively by focusing on areas with the greatest performance improvements needed.
- Maintain adherence to company-specific performance standards across all builds and devices.
The Last refresh date on this dashboard refers to the date and time when the data displayed on the dashboard was last updated or refreshed from the underlying data sources. You can know the data’s freshness and make informed decisions based on the most recent information.
This dashboard is built using the performance_transaction_details and ct_latest_version_details datasets.
The Performance Transaction dashboard consists of the following pages:
- User flow by version
- Version over version comparison
User flow by version
This page visualizes user interactions with your application across different versions. This page allows you to identify trends, performance issues, and areas for improvement in each version. By effectively monitoring and comparing user flows across versions, you can address performance issues, enhance user experience, and ultimately drive better outcomes for your business.
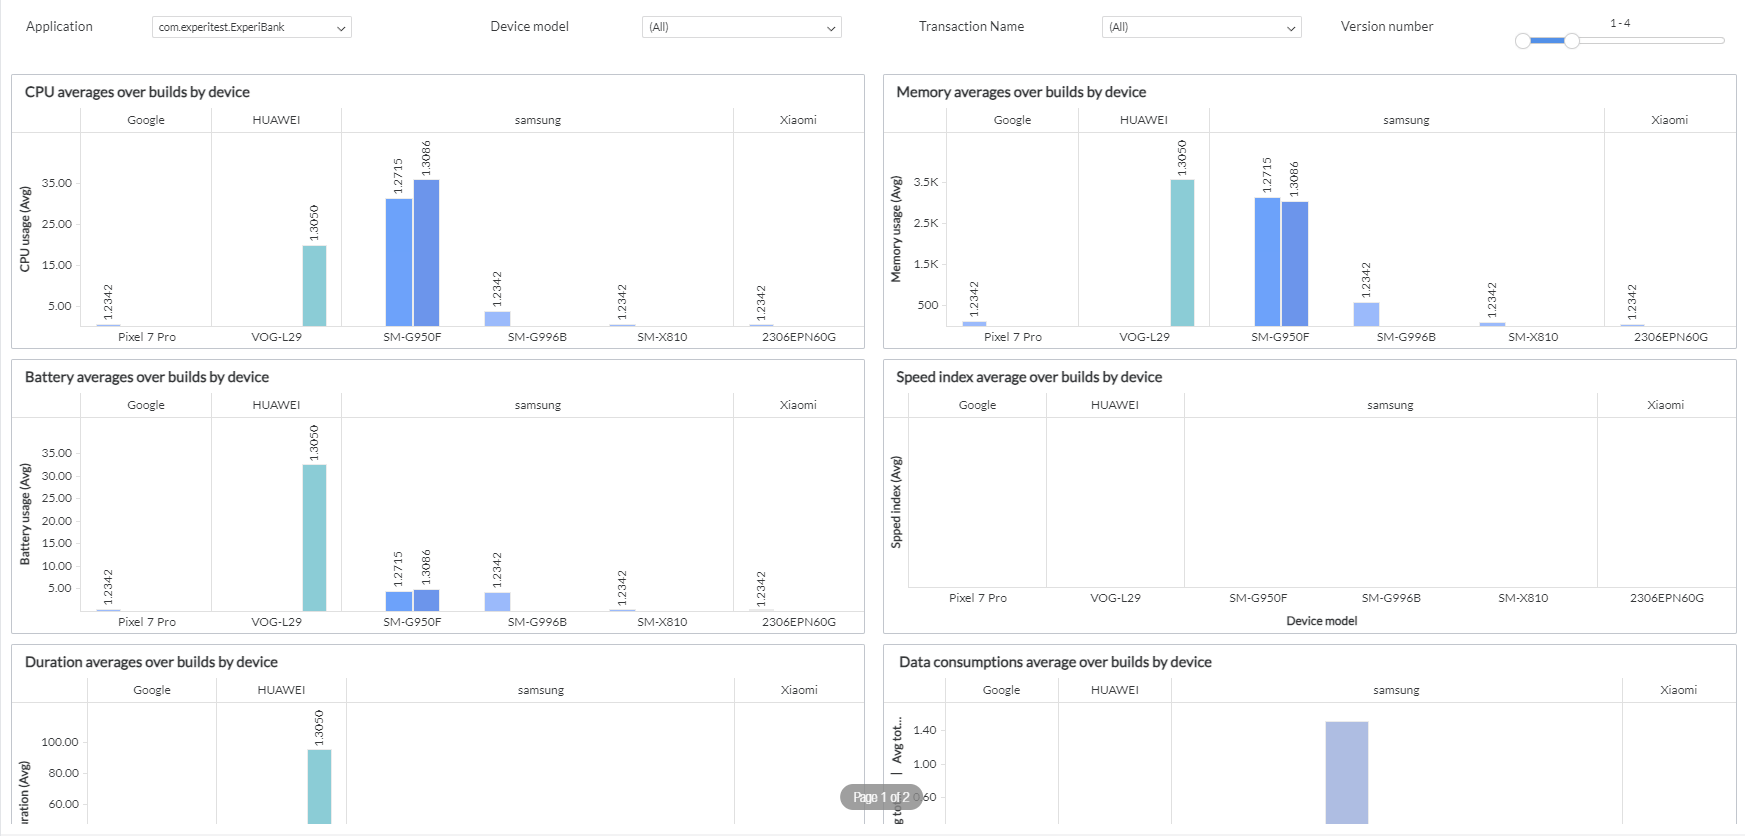
Here is an example user flow by version panel

You can filter and view the required data using the following filters:
- Project: Displays data of transactions in the selected project. This filter enables you to select the specific project you want to analyze. If your organization manages multiple projects, this filter helps to narrow down the data to a particular project for focused analysis.
- Application: Displays data of transactions in the selected application. This filter enables you to choose the specific application within a project that you want to evaluate. This is useful when a project comprises multiple applications or services, allowing you to isolate performance data for each one.
- Device model: Displays data of transactions in the selected device model. This filter enables you to select the particular device model of the application you wish to examine. By filtering data by device model, you can compare performance metrics across different device models, helping to identify any issues or improvements introduced in each device.
- Transaction name: Displays data of transactions in the selected transaction name. This filter allows you to focus on particular transactions within the application, providing detailed insights into the performance of each automated or manual transaction.
- Version number: Displays data of transactions in the selected application versions. This filter allows you to specify the version on which the application runs. It helps in understanding the application’s performance varies across different versions, providing insights into device-specific issues or optimizations.
This page consists of the following panels:
CPU averages over builds by device
This bar graph provides a visual representation of the average CPU usage for a particular application across the last four application versions. It facilitates the comparison of various devices handling different builds, highlighting performance trends and potential issues. You can hover the cursor over a bar to view device details like device manufacturer, device model, and average CPU usage.
Battery averages over builds by device
This bar graph provides a visual representation of the average battery usage for a particular application across the last four application versions. It provides insights into various devices’ performance in terms of battery consumption with each build, helping to identify trends and areas for improvement. You can hover the cursor over a bar to view device details like device manufacturer, device model, and average battery usage.
Duration averages over builds by device
This bar graph provides a visual representation of the average usage duration (time) for a particular application across the last four application versions. It provides a visual representation of various devices’ performance in terms of duration with each build, highlighting trends and potential performance improvements or regressions. You can hover the cursor over a bar to view device details like device manufacturer, device model, and average usage duration.
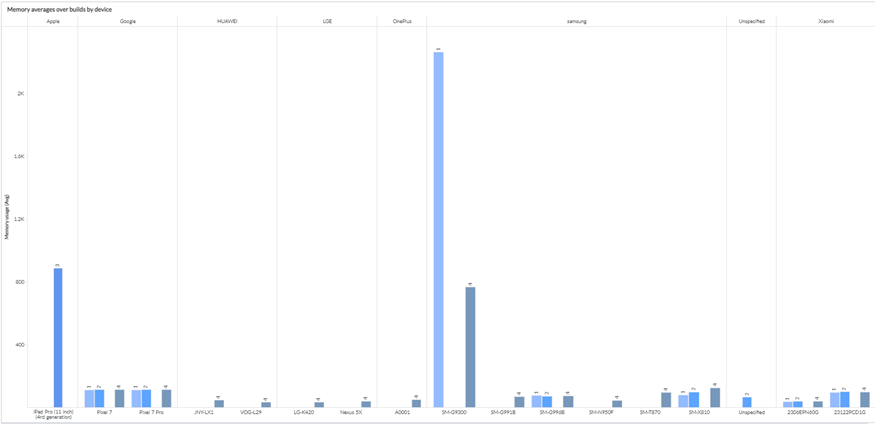
Memory averages over builds by device
This bar graph provides a visual representation of the average memory usage for a particular application across the last four application versions. It enables visualizing the management of memory consumption by various devices across each build, emphasizing trends and potential performance issues. You can hover the cursor over a bar to view device details like device manufacturer, device model, and average memory usage.
Speed Index averages over builds by device
This bar graph provides a visual representation of the average speed index for a particular application across the last four application versions. It provides a visual representation of various devices’ performance in terms of speed index with each build, highlighting trends and potential performance improvements or regressions. You can hover the cursor over a bar to view device details like device manufacturer, device model, and average speed index.
Data consumption averages over builds by device This bar graph provides a visual representation of the average data consumption (total downloaded and uploaded bytes) for a particular application across the last four application versions. It provides insights into the management of data usage by various devices across each build, highlighting trends and potential optimizations. You can hover the cursor over a bar to view device details like device manufacturer, device model, and average total upload and download bytes.
Version over version comparison
This page offers a detailed analysis of performance metrics across different application versions. By comparing key performance indicators between successive versions, this section helps identify trends, improvements, regressions, and areas requiring optimization. This page is essential for maintaining and enhancing application performance, ensuring each new release delivers a better user experience. It enables you to visualize performance trends over multiple versions, detect patterns, improvements, or declines, and identify any performance regressions introduced in newer versions. Additionally, it highlights areas where performance improved or needs further optimization, providing actionable insights for development teams to address issues promptly and efficiently.
You can filter and view the required data using the following filters:
- Project: Displays data of transactions in the selected project. This filter enables you to select the specific project you want to analyze. If your organization manages multiple projects, this filter helps to narrow down the data to a particular project for focused analysis.
- Application: Displays data of transactions in the selected application. This filter enables you to choose the specific application within a project that you want to evaluate. This is useful when a project comprises multiple applications or services, allowing you to isolate performance data for each one.
- Device model: Displays data of transactions in the selected device model. This filter enables you to select the particular device model of the application you wish to examine. By filtering data by device model, you can compare performance metrics across different device models, helping to identify any issues or improvements introduced in each device.
- Version number: Displays data of transactions in the selected application versions. This filter allows you to specify the version on which the application runs. It helps in understanding the application’s performance varies across different versions, providing insights into device-specific issues or optimizations.
This page consists of the following panels:
-
Total number of performance tests by version This panel displays the total number of transaction tests executed for each application version, categorized by device name. It provides a comprehensive count of all test events, helping to understand the distribution and volume of tests across different devices and versions. You can view the total number of transaction test events performed for each application version and break down the count by device name to analyze testing activity and distribution in detail. You can hover the cursor over a bar to view details like the application version, device name, and the number of transactions.
-
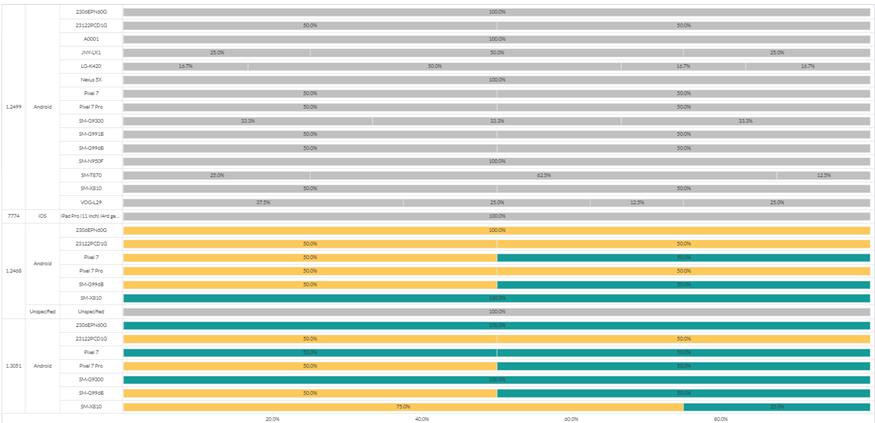
Performance changes by version This panel provides valuable insights into performance test duration trends across different versions, devices, device types, and device models, helping you optimize application performance effectively. It compares the duration of performance tests across application versions, categorized by test name and divided by device models. Each bar represents a specific application version and shows whether each test performed slower or faster compared to the immediate previous version. Each bar entry represents a unique test name, averaged if multiple tests exist under the same name. The duration of tests in the current version is compared with their duration in the immediately preceding version.
This panel allows you to visualize performance trends, determine if tests improve or degrade across versions, and optionally break down comparisons by device models to understand variations in test performance. You can hover the cursor over a bar to view details such as the application version, device OS, device model, performance transaction name, percentage difference between versions, count of performance transactions, differences less than 0, differences between 0 and 1, differences that are the same, and differences greater than 1.
The comparison is color-coded as follows:
- Red: Duration difference between the current and previous version for each application with the same performance transaction name is greater than one.
- Yellow: Duration difference between the current and previous version for each application with the same performance transaction name is between zero and one.
- Grey: No duration difference between the current and previous version for each application with the same performance transaction name.
- Green: Duration difference between the current and previous version for each application with the same performance transaction name is less than zero.
- The test duration is shorter than the previous version of the same test name.

Components used in this dashboard
The following components of the dataset are used in this dashboard:
Attributes
| Attribute Name | Description | |||
|---|---|---|---|---|
| Application Version | Version number of the application | |||
| Device manufacturer | Manufacturer of the device | |||
| Device model | Model of the device | |||
| Device Name | Name of the device, such as iPad Air or Galaxy S5 | |||
| Device OS | Operating system version of the device | |||
| Performance transaction name | Name of the performance transaction |
Metrics
| Metric Name | Description | |||
|---|---|---|---|---|
| % Diff between 0 and 1 | Percentage of tests in this version with a duration differential between 0 and 1 compared to the previous version | |||
| % Diff greater than 0 | Percentage of tests in this version with a duration differential greater than 0 compared to the previous version | |||
| % Diff is same | Percentage of tests in this version with no duration differential compared to the previous version | |||
| % Diff less than 0 | Percentage of tests in this version with a negative duration differential compared to the previous version | |||
| Average total download bytes | Average downloaded bytes | |||
| Average total upload bytes | Average total upload bytes | |||
| Battery usage (Avg) | Average battery usage | |||
| Count of performance transaction | Count of performance transactions recorded within a specific project | |||
| CPU usage (Avg) | Average CPU usage | |||
| Diff between 0 and 1 | Number of tests in this version with a duration differential between 0 and 1 compared to the previous version | |||
| Diff greater than 1 | Number of tests in this version with a duration differential greater than 0 compared to the previous version | |||
| Diff is same | Number of tests in this version with no duration differential compared to the previous version | |||
| Diff less than 0 | Number of tests in this version with a negative duration differential compared to the previous version | |||
| Duration (Avg) | Average CPU usage | |||
| Memory usage (Avg) | Average memory usage | |||
| Number of transaction | Total number of transactions | |||
| Speed index (Avg) | Average speed index |
Performance transaction details
The performance transaction details dataset provides comprehensive data and insights into the performance of various transactions within an application. This dataset is crucial for identifying bottlenecks, understanding user behavior, and ensuring that the application meets performance standards.
You can analyze the following business scenarios using the performance transaction details dataset: - Identify specific devices or builds in which performance lags, enabling targeted optimization efforts. - Review the user flows are smooth and efficient across all devices and builds, enhancing overall user satisfaction. - Identify performance regressions between builds early, allowing for timely fixes before release. - Validate that new features or updates do not negatively impact performance. - Use data-driven insights to decide whether a build is ready for release based on its performance metrics. - Allocate development resources effectively by focusing on areas with the greatest performance improvements needed.
The following are the components of this dataset:
Attributes
| Attribute Name | Description |
|---|---|
| Application | Name of the application |
| Application Version | Version number of the application |
| Created date | Date on which the transaction is created |
| Device manufacturer | Manufacturer of the device |
| Device model | Model of the device |
| Device Name | Name of the device, such as iPad Air or Galaxy S5 |
| Device OS | Operating system version of the device |
| Last refresh date | Date of the most recent update or refresh of data in a dataset. It is in date format |
| Performance transaction | Unique identifier of the performance transaction |
| Performance transaction name | Name of the performance transaction |
| Project | Name of the project |
Metrics
| Metric Name | Description |
|---|---|
| Battery usage (Avg) | Average battery consumption of a device on a specific set of transactions within a specific project |
| CPU usage (Avg) | Average utilization of the CPU during a specified set of transactions within a specific project |
| Duration | The average duration of transactions within a specific project |
| Memory average usage | Average utilization of memory across multiple transactions within a specific project |
| Speed index | Average speed index across multiple transactions within a specific project |
| Total downloaded bytes | The average volume of data downloaded over multiple transactions within a specific project |
| Total uploaded bytes | The average volume of data uploaded over multiple transactions within a specific project |
CT latest version details
The CT latest version details dataset provides essential information about the most recent version of the performance transaction. It helps users track updates, understand changes, and ensure they are working with the latest data. This dataset is critical for maintaining data accuracy and integrity in the performance transaction dashboard.
You can analyze the following business scenarios using the CT latest version details dataset:
- Compare the application performance on different devices, identifying any compatibility issues or performance discrepancies.
- Analyze performance differences between builds to ensure that each new release meets performance standards.
- Use data-driven insights to decide whether a build is ready for release based on its performance metrics.
- Maintain adherence to company-specific performance standards across all builds and devices.
The following are the components of this dataset:
Attributes
| Attribute Name | Description |
|---|---|
| Application | Name of the application |
| Application Version | Version number of the application |