Story Count by Iteration dashboard

The Story Count by Iteration dashboard displays a snapshot view of the team's average velocity in completing tasks. The velocity helps predict if you will finish all planned features on time. It also enables you to see how often the plan is changed, like when you add or remove a story from a particular part of the planning level.
The Last refresh date on this dashboard refers to the date and time when the data displayed on the dashboard was last updated or refreshed from the underlying data sources. You can know the data's freshness and make informed decisions based on the most recent information.
This dashboard is built using the Iteration planned vs actual, planning level hierarchy, portfolio item hierarchy, and planning level programs datasets.
Story Count by Iteration
Displays the trend of stories in iterations. Each bar on this panel represents the planned, added, and completed stories in an iteration. This panel also has a trend line that displays the percentage of completed stories in an iteration. The x-axis represents the iteration, and the y-axis represents the planned, added, and completed story count. You can hover the cursor over the panel to see the iteration name, planned, added, and completed count stories in an iteration.
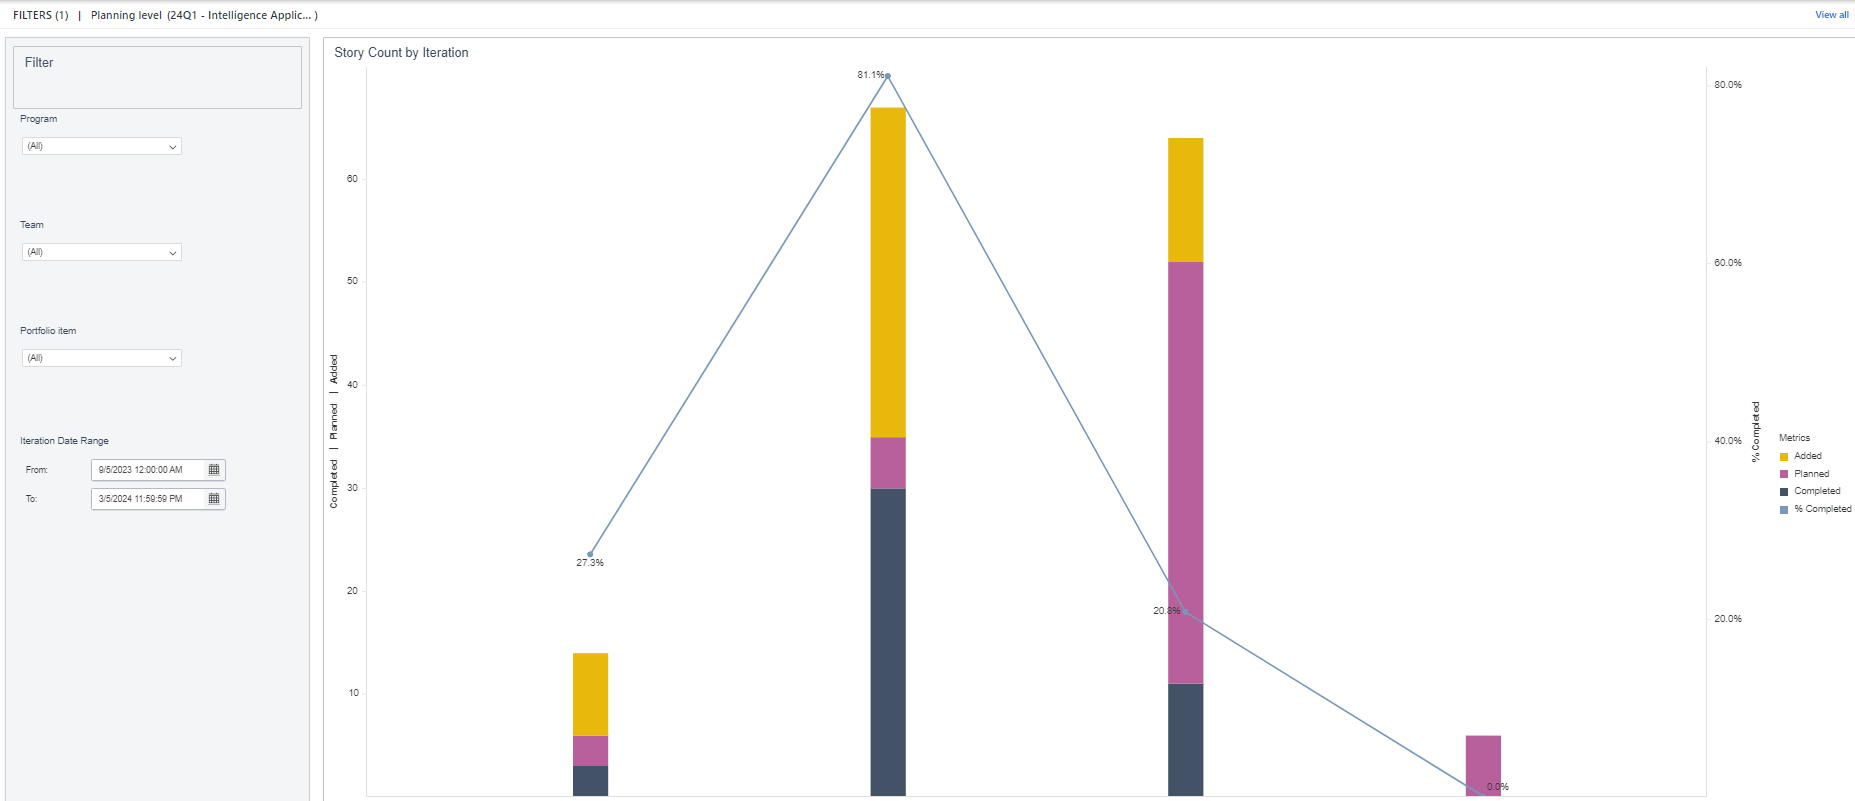
You can filter and view the required data using the following filters:
- Planning level: Displays data of stories in the selected planning level and all child planning levels that belong to the planning level.
- The following filters display filter values based on the filtered planning level.
- The following filters cascade each other except the Iteration start date range filter.
- Program: Displays data of stories in the selected program.
- Team: Displays data of a specific group of cross-functional members.
- Portfolio item: Displays data of stories in the selected portfolio item and all child portfolio items that belong to the portfolio item.
- Iteration start date range: Displays data of stories in the selected date range. This filter filters the data for the last six months by default.
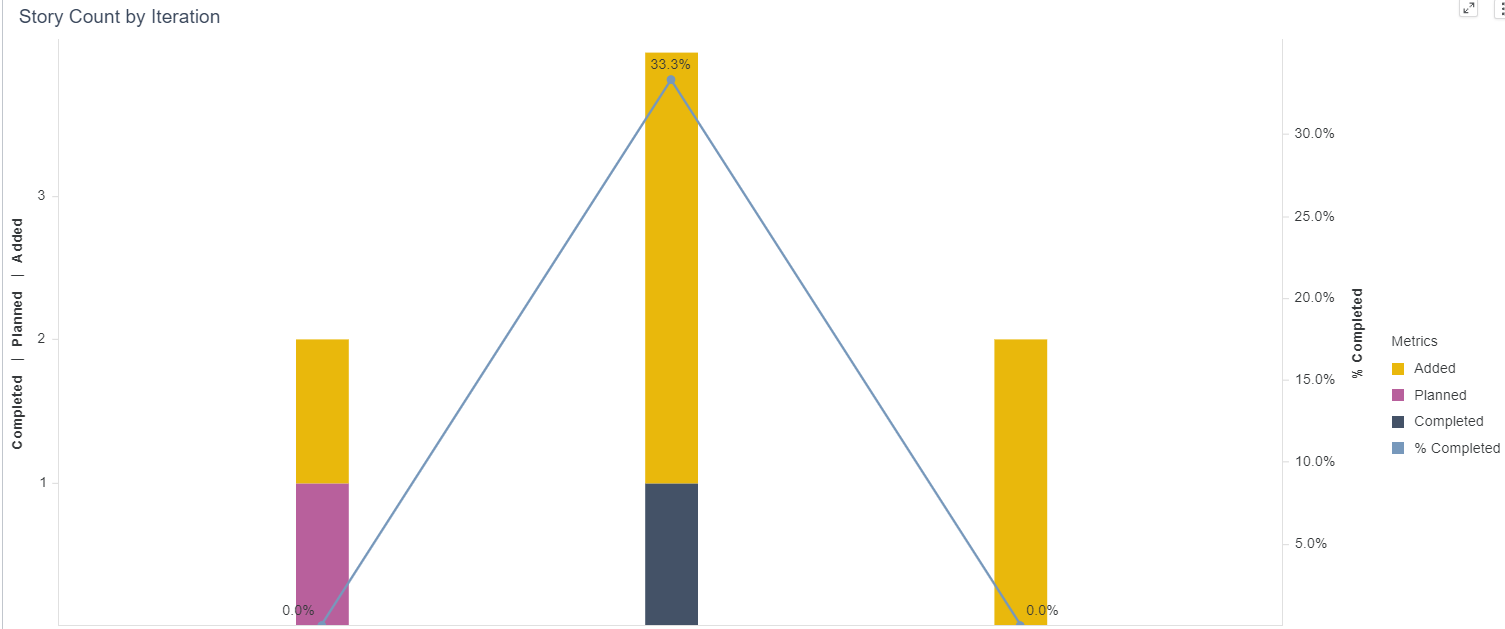
You can use these filters to refine the displayed data. For example, you can choose a team from the Team filter to view the corresponding story count by iteration dashboard. Here is an example iteration-filtered panel.
Components of dataset
The following components of the dataset are used in this dashboard:
Attributes
| Attribute Name | Description |
|---|---|
| Iteration name | Name of the iteration |
Metrics
| Metric Name | Description |
|---|---|
| Added | Count of stories added to the iteration after the iteration started |
| Completed | Count of stories completed in an iteration |
| % Completed | Percentage of stories completed in an iteration |
| Planned | Count of stories planned at the beginning of the iteration |