Defect Trend by Planning Level

The Defect Trend by Planning Level dashboard provides insights into how defects trend across a group of planning levels, specifically at the end date of that planning level. It enables data-driven decision-making and proactive measures to address defects before or during planning level completion.
The Last refresh date on this dashboard refers to the date and time when the data displayed on the dashboard was last updated or refreshed from the underlying data sources. You can know the data's freshness and make informed decisions based on the most recent information.
This dashboard is built using the Defect trend by planning level, planning level hierarchy, work item goals, backlog group hierarchy, portfolio item hierarchy, and planning level programs datasets.
Defect Trend by Planning Level
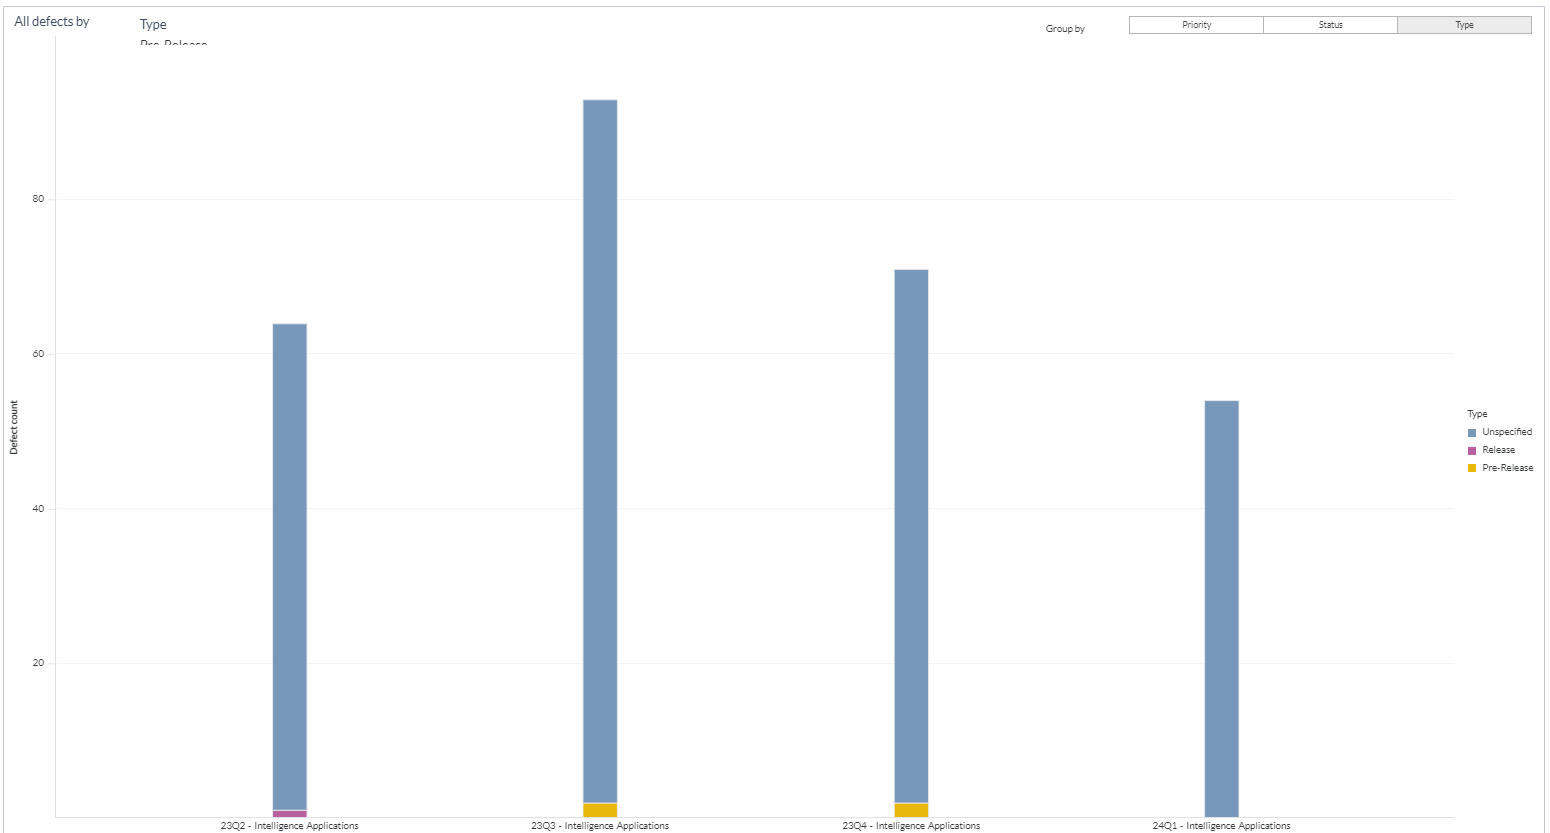
Displays trends of defects across various planning levels. Each bar on this panel represents a single planning level. The height of the bar indicates the number of defects on the last day of the planning level. If the planning level doesn’t reach the end date, the bar represents the total number of defects in that planning level today. The x-axis represents the planning level, and the y-axis represents the defect count. You can hover the cursor over a bar to view details like work item type or priority or status, planning level, and defect count.
Here is an example Defect Trend By Planning Level panel.
You can filter and view the required data using the following filters:
- Planning level: Displays data of defects in the selected planning level and all child planning levels that belong to the planning level.
- The following filters display filter values based on the filtered planning level.
- The following filters cascade each other except the Planning level start date range filter.
- Program: Displays data on defects in the selected program.
- Backlog group: Displays data of defects in the selected backlog group and child backlog group that belongs to the backlog group.
- Team: Displays data of a specific group of cross-functional members.
- Portfolio item: Displays data of defects in the selected portfolio item and all child portfolio items that belong to the portfolio item.
- Backlog goal: Displays data of defects in the selected backlog goal.
- Defect state: Displays data of defects in any of the following reporting category states: in progress and closed.
- Planning level start date range: Displays data of a specific date range or period.
- Group by: Displays data of defects in any of the following dimensions: status, priority, and defect type.
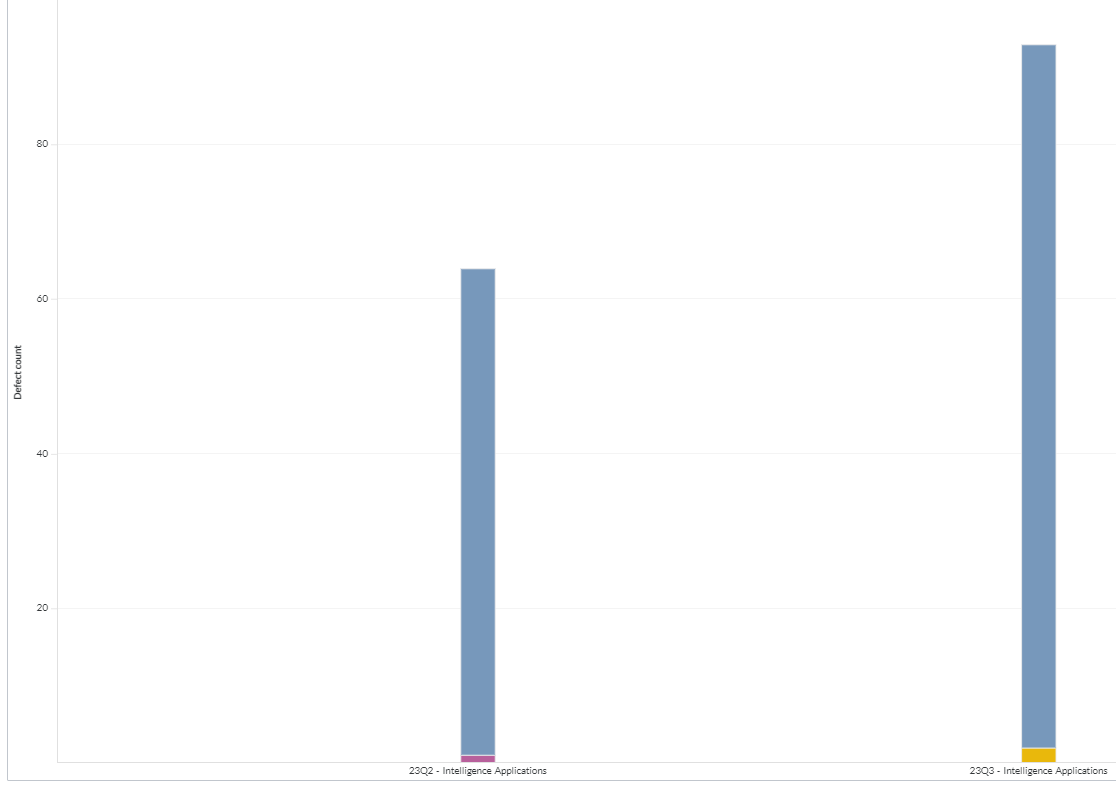
You can use these filters to refine the displayed data. For example, you can choose a program from the Program filter to view the corresponding dashboard. Here is an example program-filtered panel.
Components of dataset
The following components of the dataset are used in this dashboard:
Attributes
| Attribute Name | Description |
|---|---|
| Planning level | Name of the planning level |
| Type | Type of defect, as in source |
| Priority | Priority of the defect |
| Status | Status of the defect as mentioned in the source |
Metrics
| Metric Name | Description |
|---|---|
| Defect count | Count of defects at the planning level |