Viewing Dependencies
Learn all the places you can see work item dependencies within Digital.ai Agility.
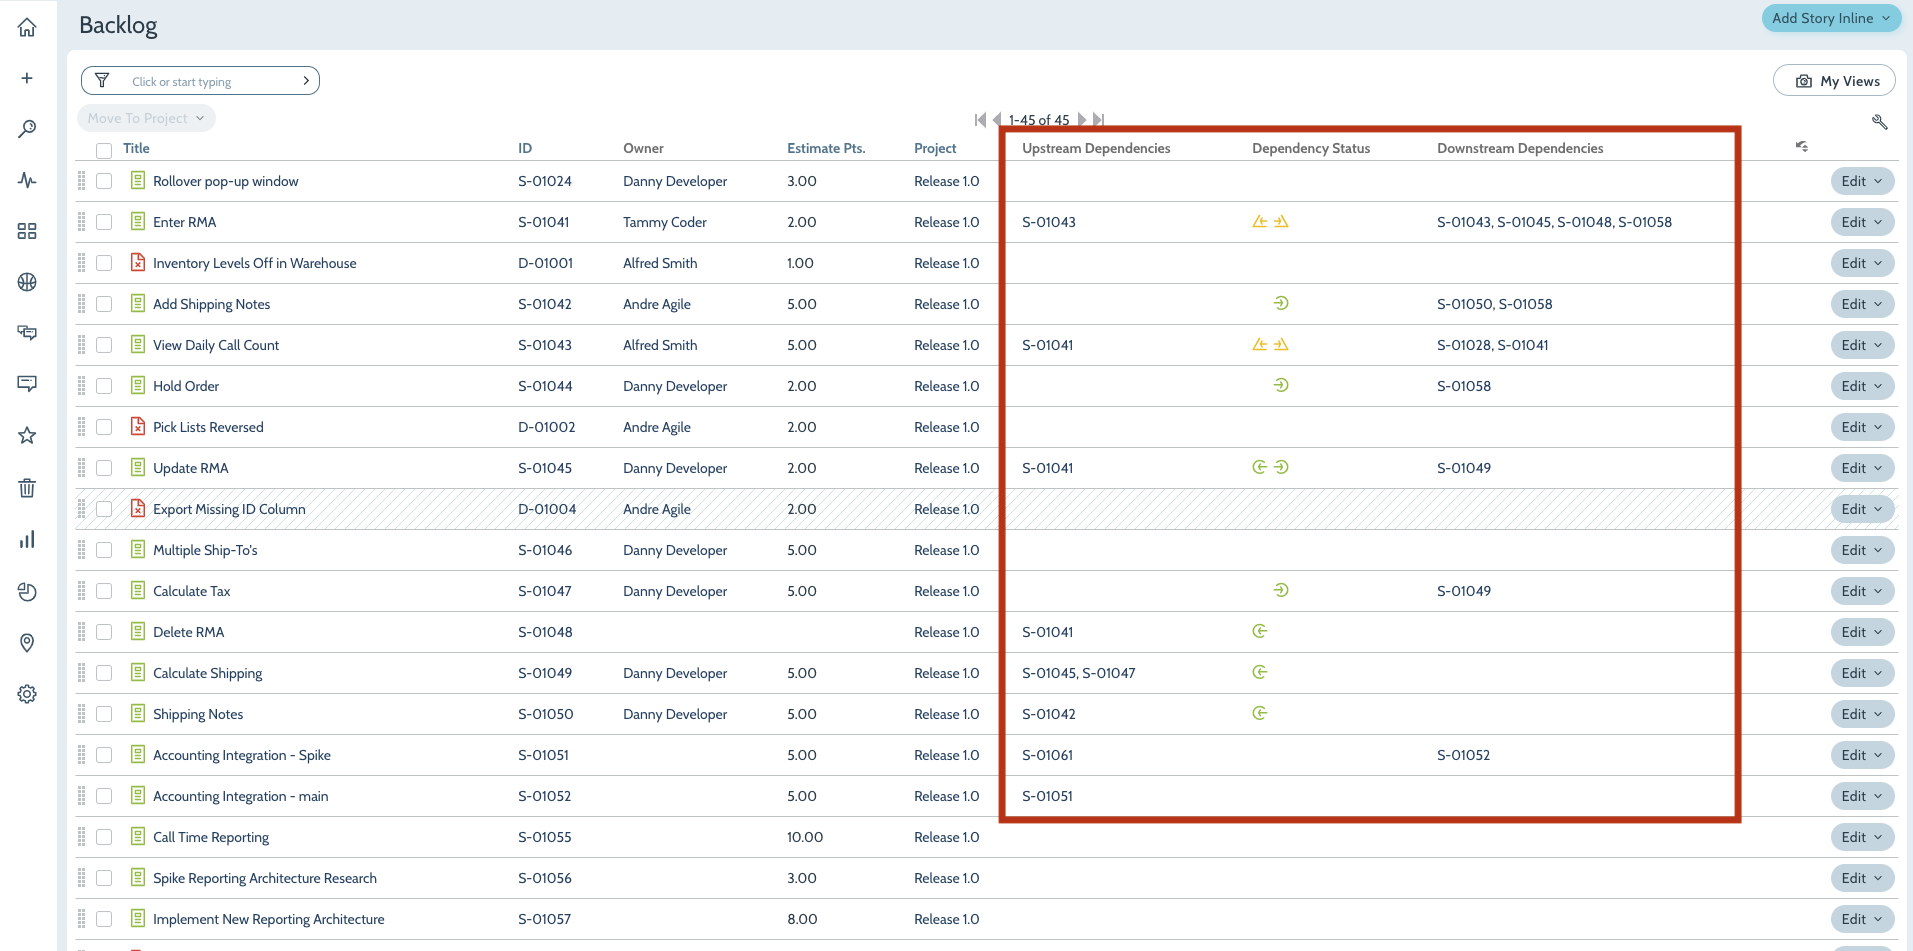
Option 1. In Release Scheduling and Sprint Scheduling Grids
You can also see dependencies in the Release Scheduling and Sprint Scheduling grids by adding the following columns to the grid. Note that these columns are hidden by default.
- Upstream Dependencies - Shows that other stories must be completed before the current story can be completed
- Downstream Dependencies - Shows stories that are dependent on the completion of the current story
- Dependency Status Icon - Indicates that the dependency is satisfied, broken, or overlapping (as the dependencies change during the course of a sprint or iteration, status icon changes to reflect the status).

When setting up dependency relationships between primary work items ( Backlog Items and Defects) in Digital.ai Agility, here are a few important things to understand:
- Primary work items can have an unlimited number of dependency relationships.
- Dependency status is evaluated using the sprint dates for each item. This allows you to evaluate dependencies assigned to different teams or projects.
- Dependencies can have three states:
- Green - Satisfied: dependencies exist and are being satisfied by the current sprint scheduling
- Yellow - Warning: dependencies exist and the sprints in which they are scheduled overlap
- Red - Broken: dependencies exist and are broken by the current sprint scheduling
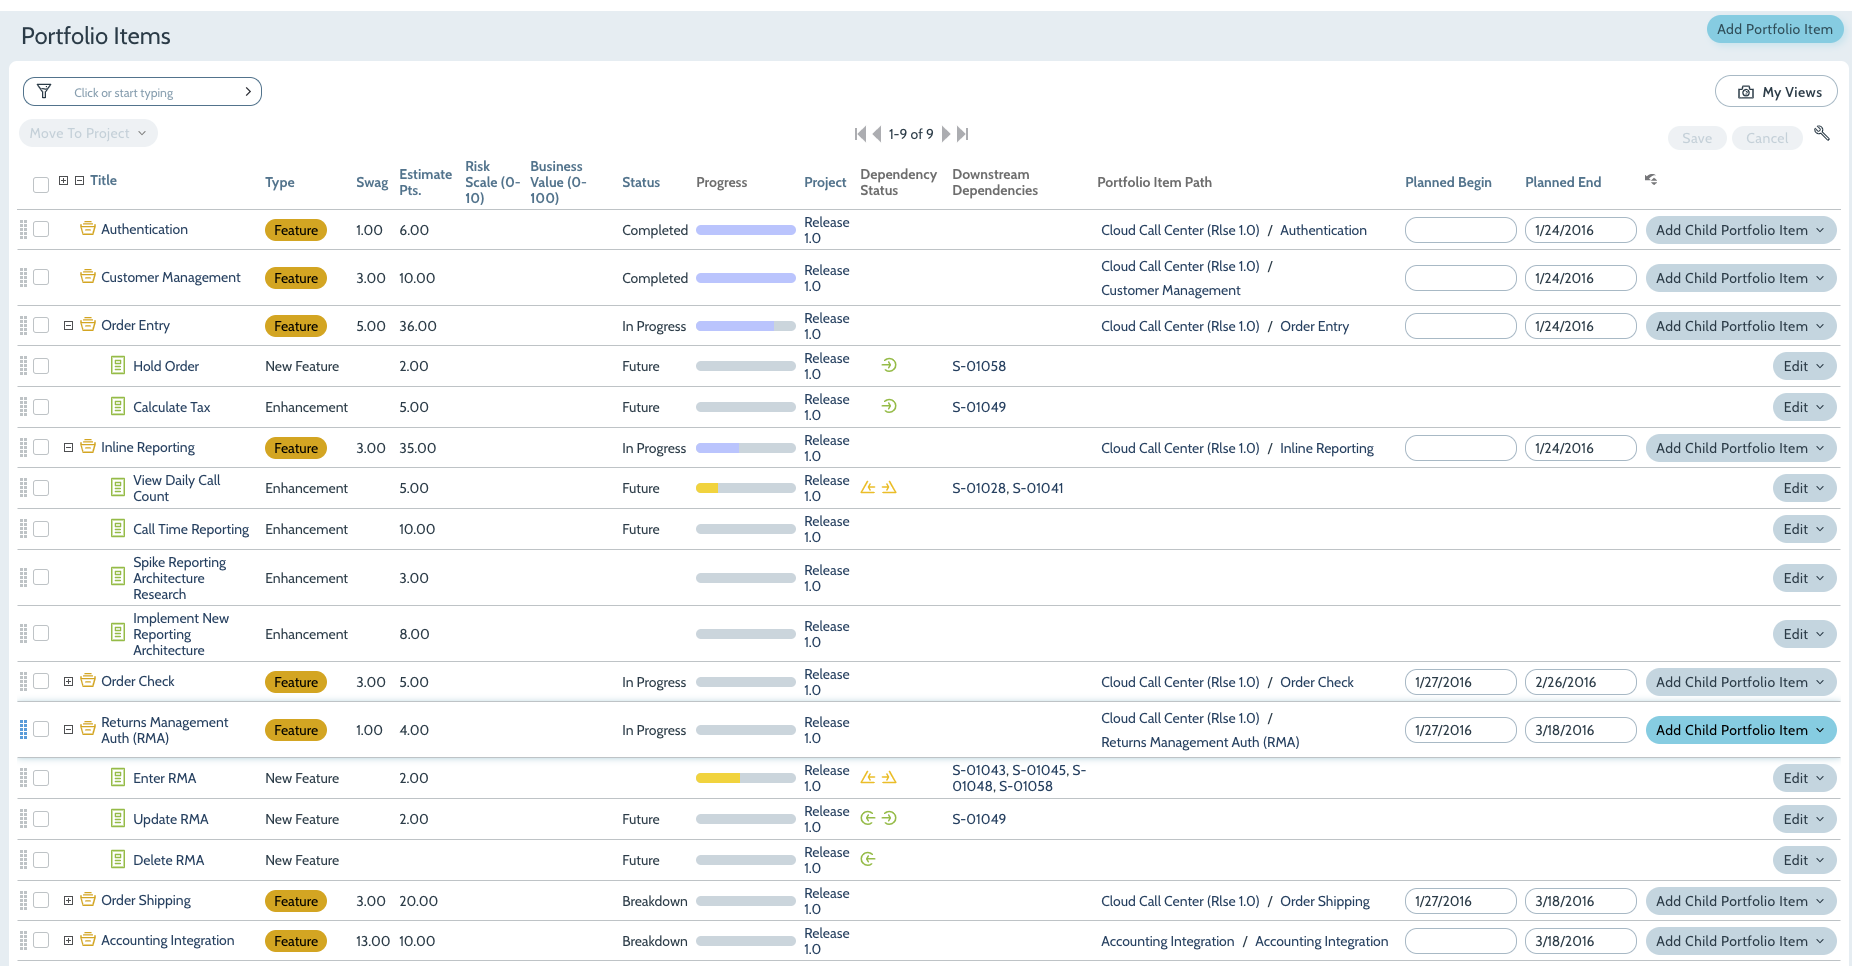
Option 2. Portfolio Item Grid
Portfolio Item Dependencies can be viewed on the Portfolio Item Grid

When setting up dependency relationships between Portfolio Item in Digital.ai Agility, here are a few important things to understand:
-
Portfolio Items can have an unlimited number of dependency relationships.
-
Dependency status is evaluated using the Planned End Date for each item. This allows you to evaluate dependencies assigned to different teams or projects.
-
Dependencies Status Colors are based on the following rule
-
Green - Satisfied: dependency exists and the downstream end date is after the upstream end date
-
Yellow - Warning: dependency exists and the downstream end date equals the upstream end date
-
Red - Broken: dependency exists and
-
- the downstream end date is before the upstream end date
- or the downstream has an end date and the upstream end date cannot be determined. In this case you don't know if you can deliver on the commitment
-
No Dependency Status icon exits when
-
- both the upstream and downstream end dates cannot be determined
- or If the upstream has an end date and the downstream end date cannot be determined
- or there are no dependencies
-
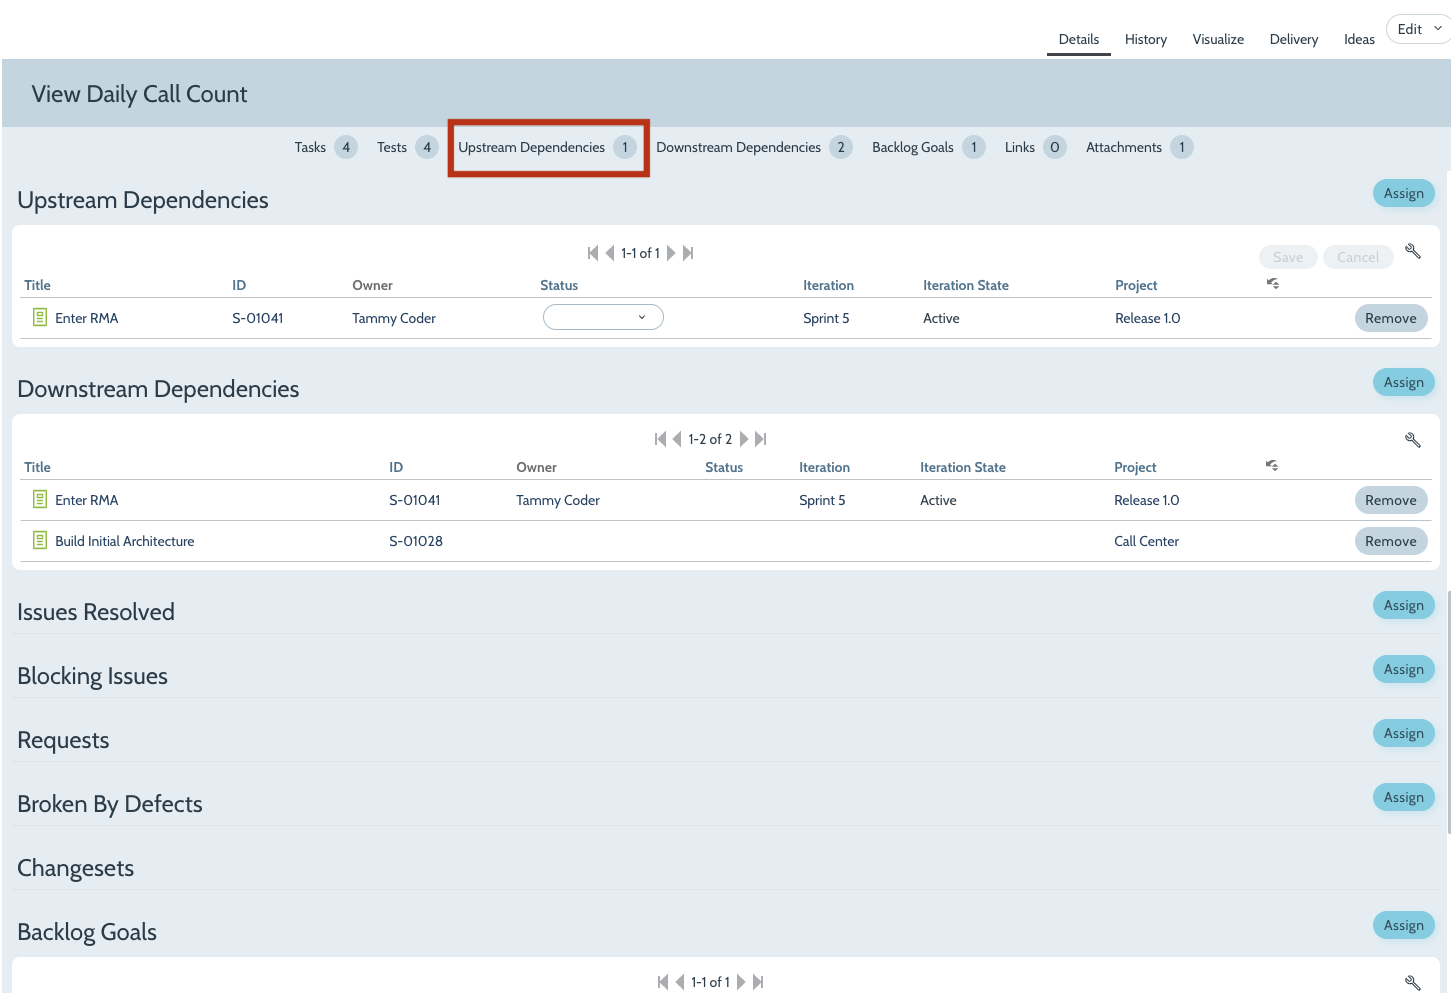
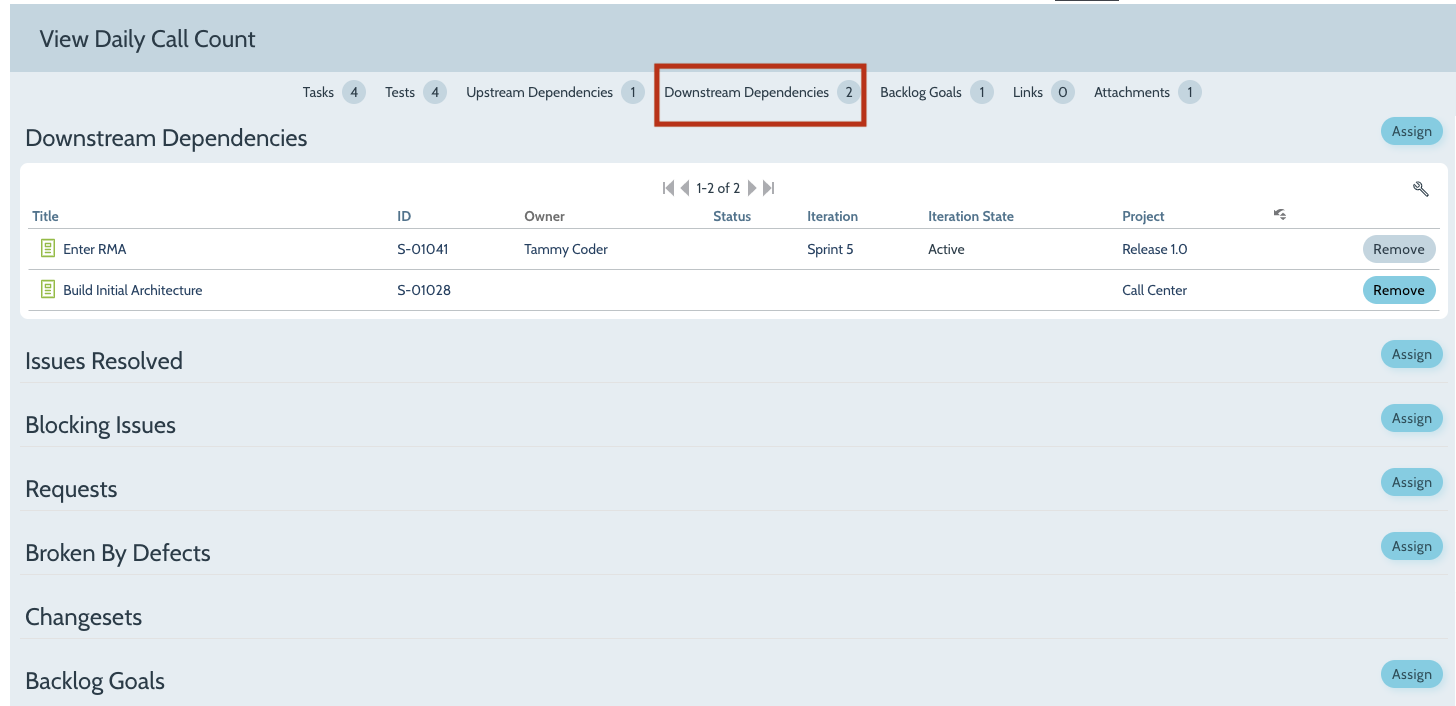
Option 3. On the Details Page
Dependencies for a specific Portfolio Item or Backlog Item can be see from the asset details page. Open the Details page and then click Downstream Dependencies or Upstream Dependencies. The dependencies grid will display the dependent relationships.


Option 4. Dependency Visualization Reports
These dependency reports allow you to view all active dependencies defined in a project or program. Reading from left to right, they show the sequence necessary to deliver backlog items, defects, test sets, and portfolio items (respectively) in a dependency chain.
- Workitem Dependencies Visualization Report
- Portfolio Item Dependencies Visualization Report
Option 5. The Dependency Board
Refer to the Dependency Board help page for more details on this option.