Creating Custom Tiles
In Digital.ai Release you can customize the release dashboard by adding new tiles as per your specific requirements to know about your planning information. This topic describes how to create custom tiles.
You can create and add custom tiles to your global dashboard.
Dashboard tile structure
A dashboard tile is based on the following concepts:
- It displays a snippet of specific information about a release on the release dashboard.
- It can be configured. You can define properties of a tile which can be set per tile instance. One release dashboard can have several instances of the same tile type with different configurations. For example, you can use the Task progress tile various times to keep track of different types of tasks.
- It contains a server side Jython script that prepares the information which will be displayed by the tile.
- Optionally, it has a details view that is displayed as a full page and that can contain additional information.
Creating Latest commits tile to display commits from GitHub repository
This tutorial describes the basic steps needed to create a Latest commits tile and uses all the concepts mentioned above. The purpose of the tile is to display the latest commits from a GitHub repository. The tile will use a Jython script to fetch the commits and it will contain HTML and CSS code to display them in the Release GUI.
When creating Release plugins you should start writing code in the XL_RELEASE_SERVER_HOME/ext/ directory than to package your plugin in a JAR file right away. This allows you to apply changes by refreshing your browser and does not require a restart of the Release server. The changes to Jython, HTML, CSS, and possibly to the JavaScript code are applied on every browser refresh. This results in a shorter development cycle. The changes to synthetic.xml will still require a restart of the Release server. When the code is ready, you can package it in a JAR file of your plugin.
Configure a tile
To create a new tile:
-
Define the tile model in
XL_RELEASE_SERVER_HOME/ext/synthetic.xml.synthetic.xmlXML snippet example:<type type="acme.LatestCommitsTile" label="Latest commits" extends="xlrelease.Tile">
<!-- Path to the HTML template of the dashboard view of the tile -->
<property name="uri" hidden="true" default="acme/LatestCommitsTile/latest-commits-tile-summary-view.html" />
<!-- Title of the tile, this property is predefined in the parent type, but here you override its default value -->
<property name="title" description="Display name of the tile" default="Latest commits"/>
<!-- Tile configuration properties -->
<property name="repositoryId" category="input" required="true" default="octocat/Hello-World"
description="GitHub repository ID in format ':owner/:repo', for example 'octocat/Hello-World'." />
<property name="branch" category="input" required="true" default="master"
description="Repository branch from which to list the commits." />
<property name="accessToken" category="input" required="false" password="true"
description="GitHub OAuth token to use for authentication." />
<property name="supportedScopes" kind="list_of_string" default="release,folder,global"
description="The location where the tile is available."/>
<property name="description" kind="string" default="My tile description"
description="A short description that is displayed on the tile."/>
</type>Explanation of the XML snippet example:
-
The new tile is created by defining a new type extending from
xlrelease.Tile. The type label 'Latest commits' will appear in the Add tile dialog when you configure the release dashboard. -
The
uriis a hidden property that must point to an HTML template used to display the tile on a dashboard. In Release, all web resources are located under theweb/folder on the classpath. In this example, it points toweb/acme/LatestCommitsTile/latest-commits-tile-summary-view.htmlin theXL_RELEASE_SERVER_HOME/extfolder.There are multiple configuration properties defined for the tile. A property appears in the tile configuration screen if it has
category="input".In this example, the following configuration properties are defined:
repositoryId-- Points to a GitHub repository.branch-- Branch to checkaccessToken-- GitHub OAuth token to use for authentication.supportedScopes-- The location in Release where you can use the tile: on release dashboard, on folder level, or on global level.description-- A short description that is displayed on the tile.
As you can see in the example
synthetic.xml, you can specify a description to explain how to use the property, and a default value. For more information about defining properties and what property types are supported, see Create custom task types.
-
-
When you have
synthetic.xmlfile is defined, restart Release. -
Open a dashboard of any release or template, click Configure.
-
Click Add tile to see the new Latest commits tile type.
-
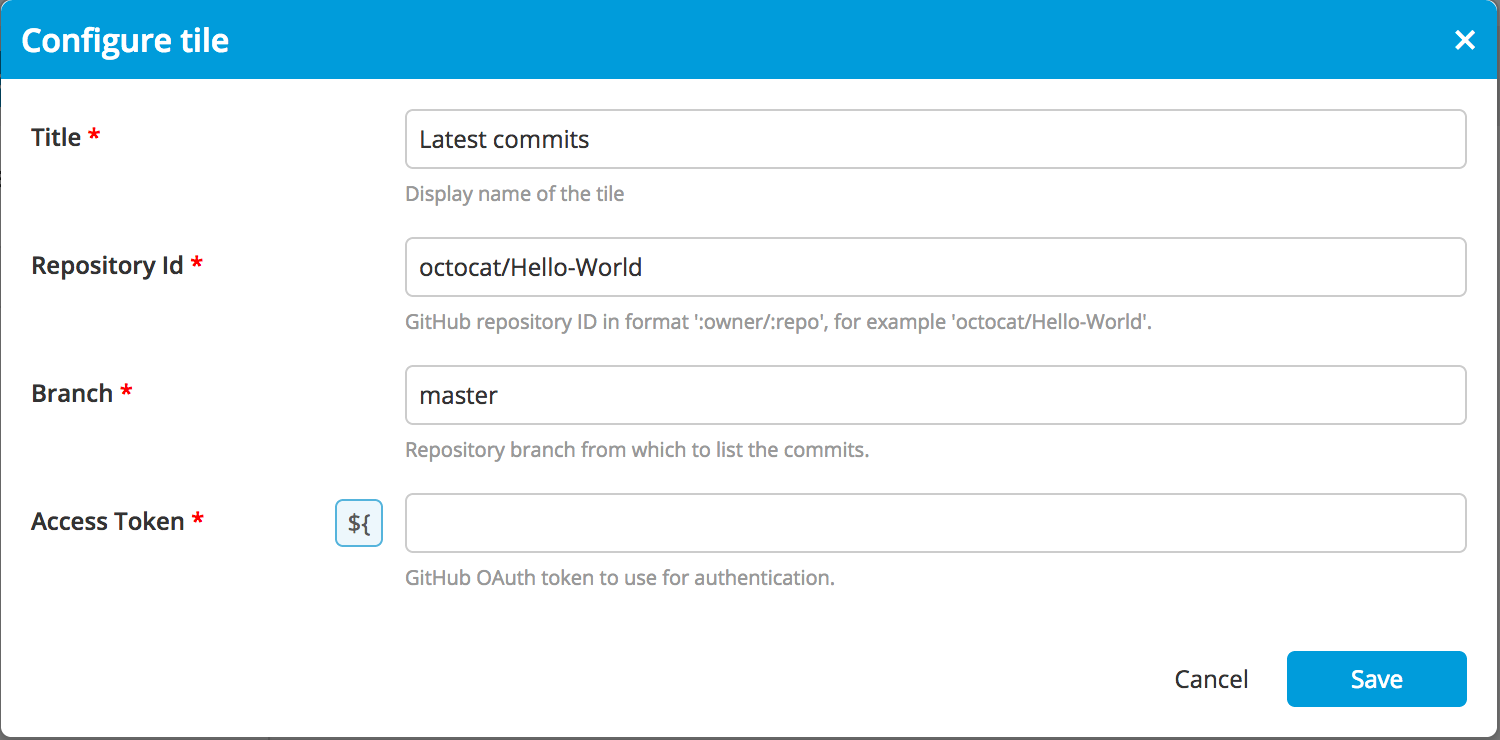
Click Configure on the tile, to see the properties of the tile.

Title is a property shared by all tiles and is displayed on top, followed by the properties defined in the
synthetic.xml. Note: You do not need to create a separate UI for the configuration screen, it is automatically generated from the tile definition. -
To add content, create the file
web/acme/LatestCommitsTile/latest-commits-tile-summary-view.htmland add the following:<html>
<body>
Hello from the <b>Latest Commits</b> tile!
</body>
<html> -
Reload the page and you will see the welcome message in the tile.
Add an HTML template
In order to show some dynamic content, you need to write a Jython file that is run on the server side that will send some data to the client and process it there to display.
Custom tiles are embedded in an HTML IFrame. This means that you can include any javascript library without any conflicts with already bundled libraries in Release.
Release provides context information to your tile so you can access different functionality and fields from the current release. This context is injected inside the window object of the IFrame and is available when the event xlrelease.load is emitted.
You can listen to the xlrelease.load event with the following JavaScript code:
  window.addEventListener("xlrelease.load", function () {
    // your JavaScript code here
  }
The properties available under your tile context are:
window.xlrelease.tile: JSON representation of your current tile.window.xlrelease.queryTileData: A function that you can call to get the tile data, by executing the tile's Jython script (explained below in this tutorial). You need to pass your callback function as an argument to thequeryTileData. When the tile data is ready it will be passed as a single argument to your callback function. See the following example for more detailed explanation:
You can create a file XL_RELEASE_SERVER_HOME/ext/web/acme/LatestCommitsTile/latest-commits-tile-summary-view.html with the following content:
<!DOCTYPE html>
<html>
  <script>
  window.addEventListener("xlrelease.load", function () {

      // Call the Jython script and put the response inside commits <div>
      window.xlrelease.queryTileData(function (response) {
          document.getElementById("commits").innerHTML = JSON.stringify(response.data.data);
      });

  })
  </script>
  <body>
  	<h3>Commits</h3>
      <div class="latest-commits-tile-summary">
      <div id="commits"></div>
    </div>
  </body>
</html>
Explanation of the HTML snippet example:
- The JavaScript code is added inside the
window.addEventListenerfunction to have access to the Release API. - The callback for
window.xlrelease.queryTileDatais defined to get the results from the Jython script inside theresponseobject. JSON.stringifyconverts aJSON objectinto astringto allow the browser to render it on screen.document.getElementById("commits")finds the<div id="commits">in HTML, and usinginnerHTMLits contents are filled with the data.
This is the first version of the HTML template for this tile. You can use it to test the Jython script by displaying the results on the page. After you create that Jython script and when the correct data is available, you can make modifications to the HTML template for a better display.
If you refresh your browser, you will see the error: Can't find script in class-path under : acme/LatestCommitsTile.py. This occurs because the script is not yet created.
Create a Jython script
This section describes how to create a server-side script.
In this example, the tile type is acme.LatestCommitsTile and the script must be stored in a file called acme/LatestCommitsTile.py.
Create the file XL_RELEASE_SERVER_HOME/ext/acme/LatestCommitsTile.py with following content:
import json
from xlrelease.HttpRequest import HttpRequest

if accessToken is not None and accessToken.strip() == "":
    accessToken = None

url = "/repos/%s/commits?sha=%s%s" % \
      (repositoryId, branch, "&access_token=" + accessToken if accessToken else "")

print "Querying commits from GitHub API by URL %s" % url

request = HttpRequest({"url": "https://api.github.com"})
response = request.get(url, contentType='application/json')

if response.status != 200:
    raise Exception("Request to GitHub failed with status %s, response %s" % (response.status, response.response))

commits = json.loads(response.response)

data = {
    "commits": commits
}
Release provides the following variables inside the tile Jython script:
- All input properties of the tile: you can see that
repositoryId,branch, andaccessTokenare accessed directly in the script. - Release or template where the tile is present as
release. It can also be used to show the release related information in the tile. Note: This is not included in the above example. - Release public API, for example:
releaseApi,phaseApi.
This script example sends a request to the GitHub API to retrieve the latest commits on a specified repository or branch, optionally adding the access token as a request parameter. You can see what the API returns by executing the following cURL command:
curl -v https://api.github.com/repos/octocat/Hello-World/commits?sha=test
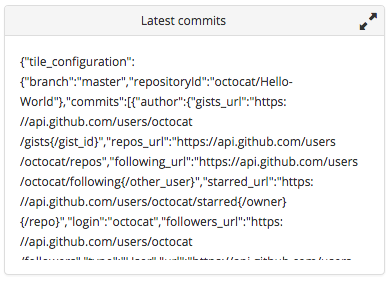
The result of the tile script execution must be placed into the data variable. Release takes the data variable from the script and sends it back to the front end. In this example, the data variable contains a dictionary with the commits retrieved from GitHub and with the configuration properties of the tile. These will be used to display where the commits came from on the dashboard.
If you refresh the browser, you can see the raw data returned by the script in your tile:

Disable caching when creating a tile
Changes in the tile script are not always applied when refreshing the browser page. This is caused by the server side caching of the tile execution results. Release caches the tile script result per tile input parameters, so if multiple users open the same release, the external resource, which is GitHub in this case, will not be called multiple times. This increases the speed of dashboard rendering and protects external resources from getting too many requests from Release. For example, GitHub has a rate limit in the API, so without caching, the tile would not work for many users.
By default, script results are cached for 5 minutes. You can override caching settings in the type definition of the tile:
<type type="acme.LatestCommitsTile" label="Latest commits" extends="xlrelease.Tile">
    <property name="cacheEnabled" kind="boolean" hidden="true" default="true" description="True if tile data should be cached."/>
    <property name="userSpecificCache" kind="boolean" hidden="true" default="false" description="True if tile data should be cached per user."/>
    <property name="expirationTime" kind="integer" hidden="true" default="300" description="Expiration time for a tile cache (in seconds)."/>
    <property name="maxCacheEntries" kind="integer" hidden="true" default="500" description="Maximum cache entries."/>
    ...
While developing a tile you can temporarily disable the caching using the cacheEnabled property. The script will be executed on every browser page refresh, so you can see your changes immediately. You must enable caching when the tile development is finished.
Set default values for required variables
If an input property uses variables, those variables are replaced before being passed to the script. If a user sets the branch to ${myBranch} in the tile configuration, and the variable ${myBranch} has the value "master" in the release, you can see branch == "master" in the tile script. For a template, the default value of the variable is used.
If a tile property contains a required variable which does not have a value, the execution of the tile script fails with an error. This occurs less frequently in a release dashboard, because usually the required variables are set when creating a release.
In a template a required variable can be empty more often. If you want to use the dashboard, we recommended that you set the default values for these variables in templates.
Display the data
You can enhance the latest-commits-tile-summary-view.html template to display the data. Update the content using the following example:
<!DOCTYPE html>
<html>
<head>
    <link rel="stylesheet" href="latest-commits-tile.css" type="text/css">
    <script
            src="https://code.jquery.com/jquery-3.2.1.min.js"
            integrity="sha256-hwg4gsxgFZhOsEEamdOYGBf13FyQuiTwlAQgxVSNgt4="
            crossorigin="anonymous"></script>
    <link href="https://fonts.googleapis.com/css?family=Open+Sans" rel="stylesheet">
</head>
<script>
    window.addEventListener("xlrelease.load", function () {

            window.xlrelease.queryTileData(function (response) {
                var commits = response.data.data.commits;
                commits.forEach(function (commitData) {
                    $("#commits").append(
                        '<li class="commit">' +
                            '<span class="commit-message">' + commitData.commit.message + '</span>' +
                            '<span class="commit-author"> (' + commitData.commit.author.name + ')</span>' +
                        '</li>'
                    );
                })
            });

            var repositoryId = window.xlrelease.tile.properties.repositoryId;
            var branch = window.xlrelease.tile.properties.branch;
            $("#title").html("Latest commits in " + repositoryId + "/" + branch);

      });
</script>
<body>
<div class="latest-commits-tile-summary">
    <h3 id="title"></h3>
    <ul id="commits">

    </ul>
</div>
</body>
</html>
The JavaScript code parses the response from GitHub and creates new HTML tags to show the commit message and the commit author in a list format.
To display the repositoryId and branch, you have access to the tile configuration properties by way of window.xlrelease.tile.properties.
You can declare external dependencies on the head element like CSS styles and JavaScript libraries such as jQuery.
Create a file XL_RELEASE_SERVER_HOME/ext/web/acme/LatestCommitsTile/latest-commits-tile.css using the following content:
body {
  font-family: 'Open Sans', sans-serif;
}
.latest-commits-tile-summary {
  font-size: 12px;
}
.latest-commits-tile-summary ul {
  margin-left: 5px;
  padding-left: 0;
}
.latest-commits-tile-summary .commit {
  padding: 2px 0;
  list-style-position: inside;
}
.latest-commits-tile-summary .commit .commit-author {
  color: #999999;
}
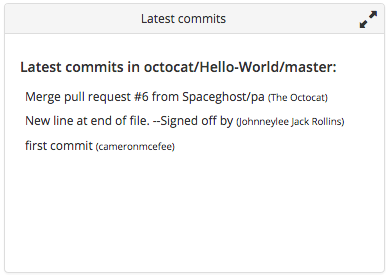
If you refresh the page, the tile looks like this:

Display data in details view
The content box of a dashboard tile is small and can be expanded only horizontally. To allow a user to see more information, you can define the details view of a tile to match the size of a dashboard. You can switch from the summary view to the details view by clicking anywhere on the tile.
The details view is enabled when you override the detailsUri property of your tile with a non-empty default value:
<type type="acme.LatestCommitsTile" ...>
    ...
    <!-- Path to the HTML template of the details view of the tile -->
    <property name="detailsUri" hidden="true" default="acme/LatestCommitsTile/latest-commits-tile-details-view.html" />
    ...
Since we made changes to the synthetic.xml file, we need to restart the server. After restarting, you can click on the tile to go the details view. You can create the HTML template for this view in XL_RELEASE_SERVER_HOME/ext/web/acme/LatestCommitsTile/latest-commits-tile-details-view.html:
<!DOCTYPE html>
<html>
<head>
  <!-- Bootstrap CSS dependency -->
    <link rel="stylesheet" href="https://maxcdn.bootstrapcdn.com/bootstrap/3.3.7/css/bootstrap.min.css"
          integrity="sha384-BVYiiSIFeK1dGmJRAkycuHAHRg32OmUcww7on3RYdg4Va+PmSTsz/K68vbdEjh4u" crossorigin="anonymous">
    <link rel="stylesheet" href="latest-commits-tile.css" type="text/css">
    <script
            src="https://code.jquery.com/jquery-3.2.1.min.js"
            integrity="sha256-hwg4gsxgFZhOsEEamdOYGBf13FyQuiTwlAQgxVSNgt4="
            crossorigin="anonymous"></script>
    <link href="https://fonts.googleapis.com/css?family=Open+Sans" rel="stylesheet">
</head>
<script>
    window.addEventListener("xlrelease.load", function () {

        window.xlrelease.queryTileData(function (response) {
            var commits = response.data.data.commits;
            commits.forEach(function (commitData) {
                $("#commits").append(
                    '<tr>' +
                    '<td><a href="' + getAuthorUrl(commitData) + '" target="_blank_">' + commitData.commit.author.name + '</a></td>' +
                    '<td><a href="' + getCommitUrl(commitData).html_url + '" target="_blank_">' + commitData.commit.message + '</a></td>' +
                    '<td>' + commitData.commit.author.date + '</td>' +
                    '</tr>'
                );
            })
        });

        var repositoryId = window.xlrelease.tile.properties.repositoryId;
        var branch = window.xlrelease.tile.properties.branch;
        $("#title").html("Latest commits in repository " + repositoryId + ", branch " + branch);

    });

    function getAuthorUrl(commitData) {
        if (commitData.author) return commitData.author.html_url;
    }

    function getCommitUrl(commitData) {
        if (commitData.html_url) return commitData.html_url;
    }
</script>
<body>
<h3 id="title"></h3>
<table class="table table-rounded table-striped">
    <thead>
    <tr>
        <th>User</th>
        <th>Message</th>
        <th>Date</th>
    </tr>
    </thead>
    <tbody id="commits">

    </tbody>
</table>
</body>
</html>
As in the summary view, all the information from the Jython script is added inside the HTML, in this case inside a table. You can also add a reference to Bootstrap CSS to style the table.
To see the latest commits rendered as a table, refresh the page and click on the tile.
