Stitch preview
When you use the Preview option of the deployment plan, you can also see the Stitch preview for it, by using the toggle button to switch between two views. After clicking on the Stitch preview toggle, you can also browse and view Stitch invocation details.
Note: The Stitch preview toggle will be visible only in case the Stitch invocation was triggered during the deployment plan.
The Stitch Preview run can be run using the XL CLI, see Stitch on CLIs for reference.
Preview stitch invocation
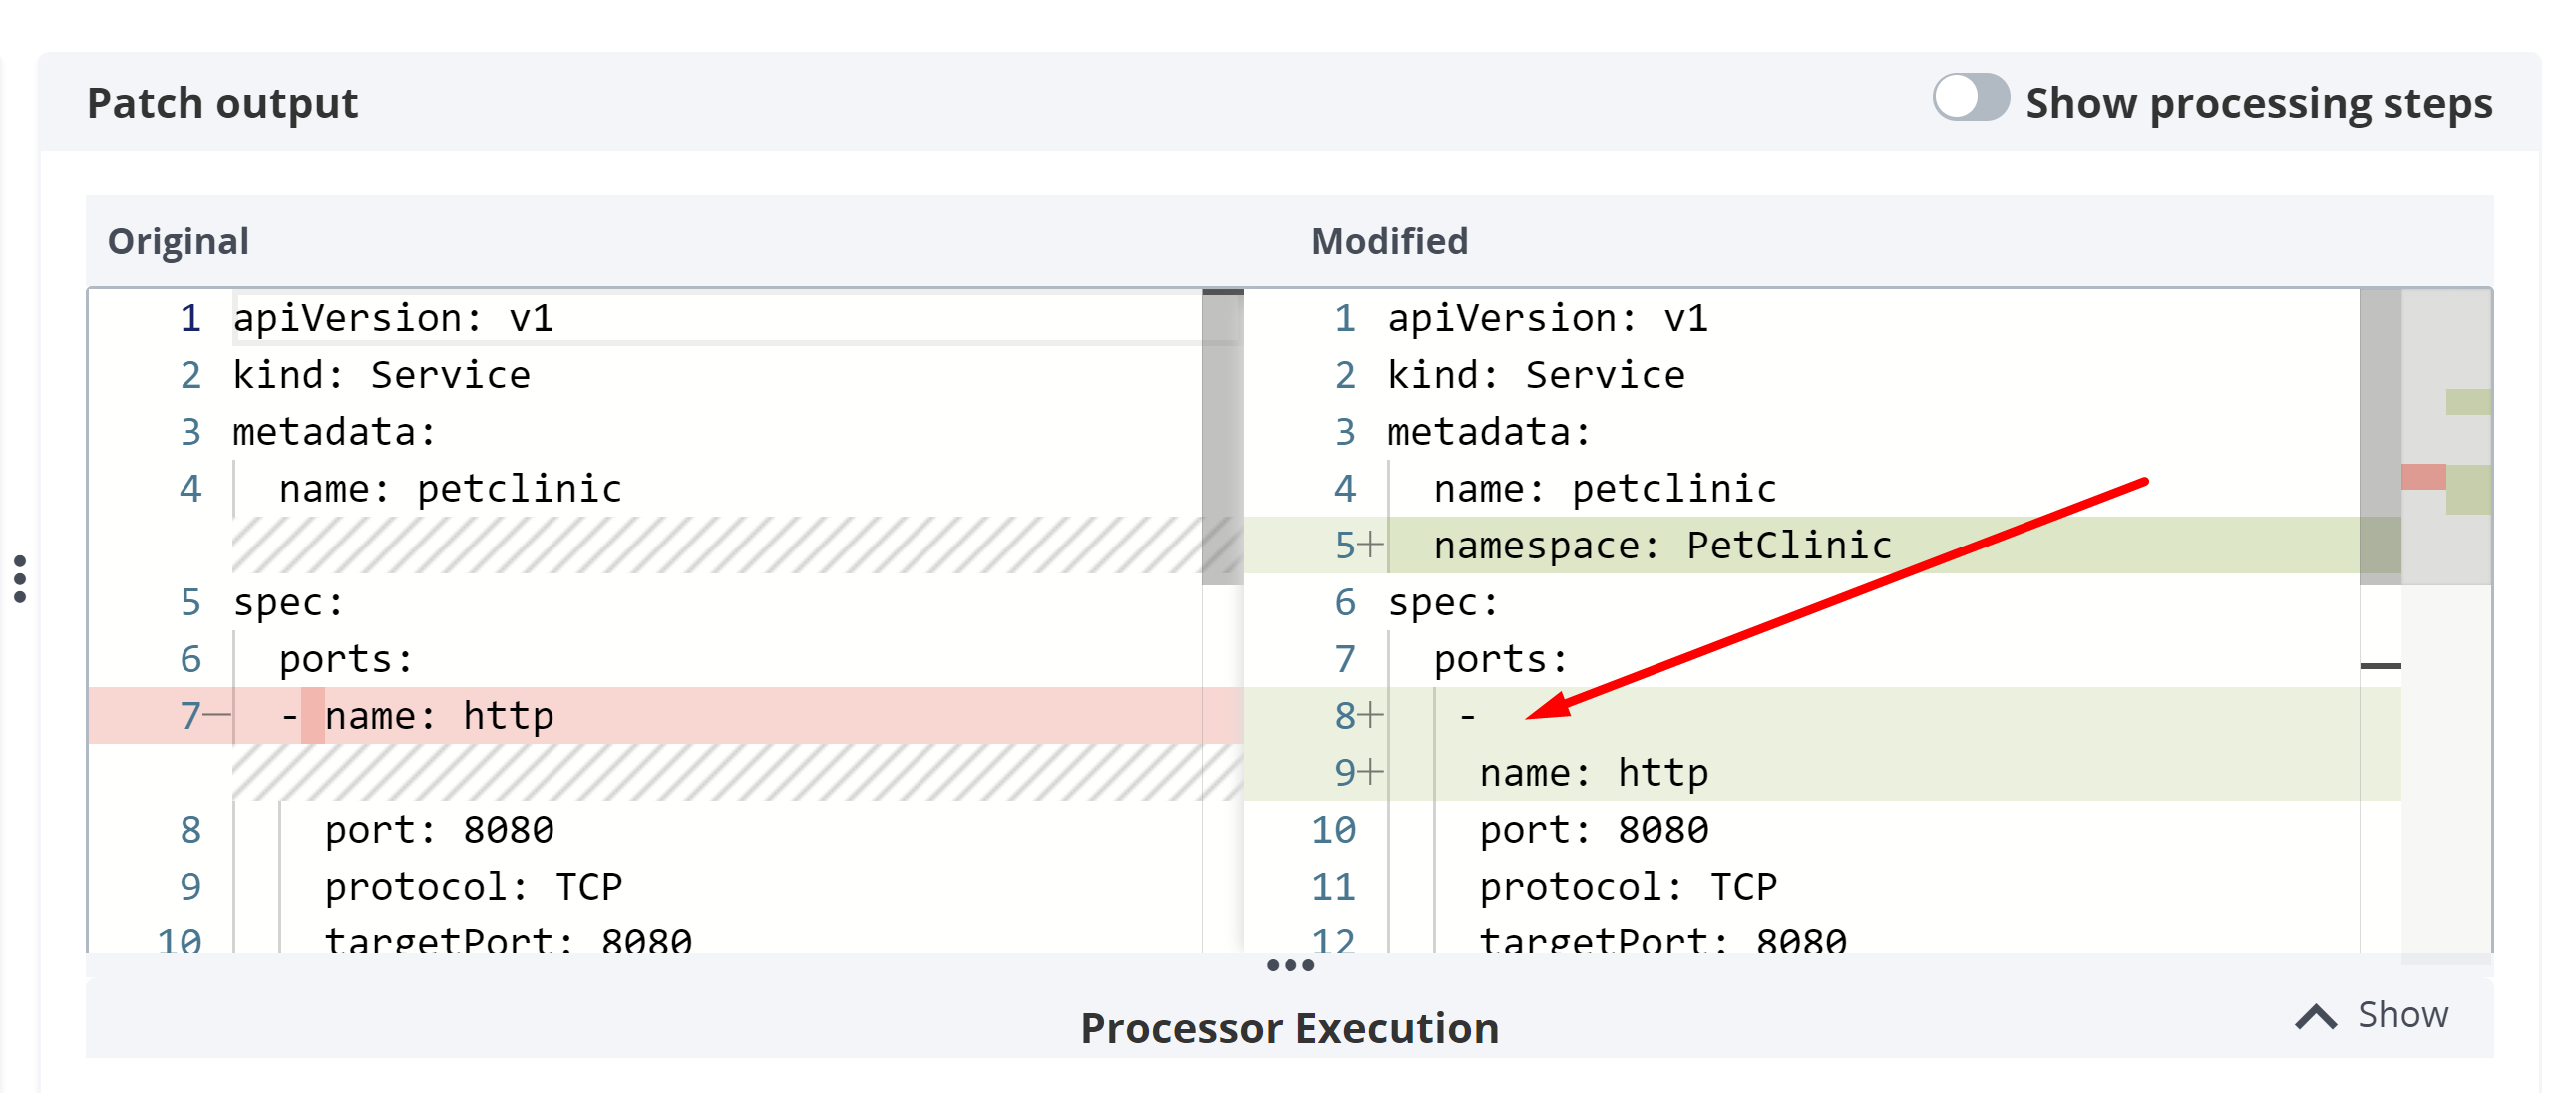
After selecting between the Deployeds from the panel on left hand side, you will be able to select from a list of Invocations of Stitch from the middle panel. By selecting it you will see the difference of input and resulting document for the given Invocation in the right hand side panel. Additionally, by toggling the processing steps, you will see the list of descriptions of used Stitch processors for the selected invocation.
Preview stitch processor execution
After toggling the processor steps, the list of processor descriptions is shown, and one can click on the info icon on the right to get more details about the executed processors and related rule. By clicking on each of the processors, you can see the difference between each Stitch processing step. The input and the resulting document diff are again shown in the right hand side panel. If the execution of the processor ended up in an error, you will be able to see it marked in error and see the details of the error by clicking on the marked processor.
