Steps and step lists
This topic describes the steps and step lists in Deploy.
A step is an action to be performed to accomplish a task. All steps for a particular deployment are grouped together in a steplist.
Deploy includes many step implementations for common actions. Steps are contributed by plugins based on the deployment that is being performed. Middleware-specific steps are contributed by the plugins.
The following are examples of steps:
- Copy file
/foo/bartohost1, directory/bar/baz. - Install
petclinic.earon the WebSphere Application Server onwas1. - Restart the Apache HTTP server on
web1.
You can perform actions on steps, but most interaction with the step will be done by the task itself.
You can mark a step to be skipped by the task. When the task is executing and the skipped step becomes the current step, the task will skip the step without executing it. The step will be marked skipped, and the next step in line will be executed.
A step can only be skipped when the step is pending, failed, or paused.
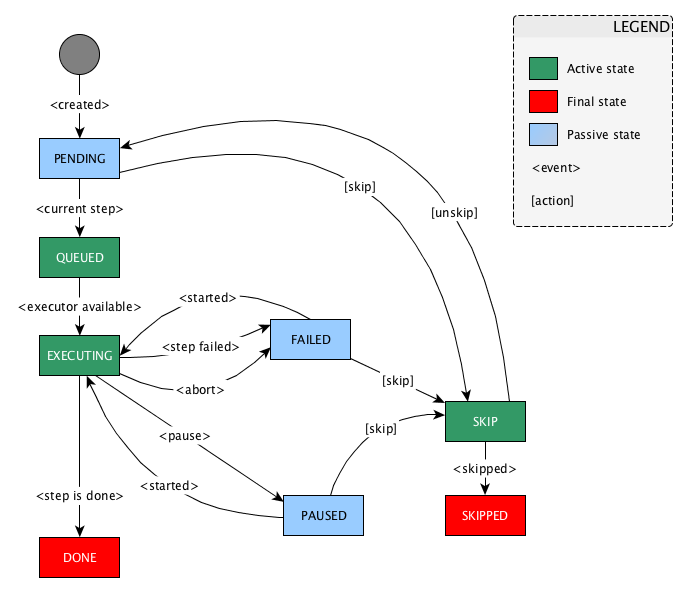
If a step executes for more than 6 hours, the step times out and changes the state to FAILED (see diagram below). You can configure this timeout in the xl block of the deploy-task.yaml file by setting a custom value for deploy.task.step.run-timeout. For more information, see Deploy Properties.
Step states
A step can go through the following states:

View step logs in the GUI
As a deployment is executed, you can monitor progress of each step in the deployment plan using the step log.
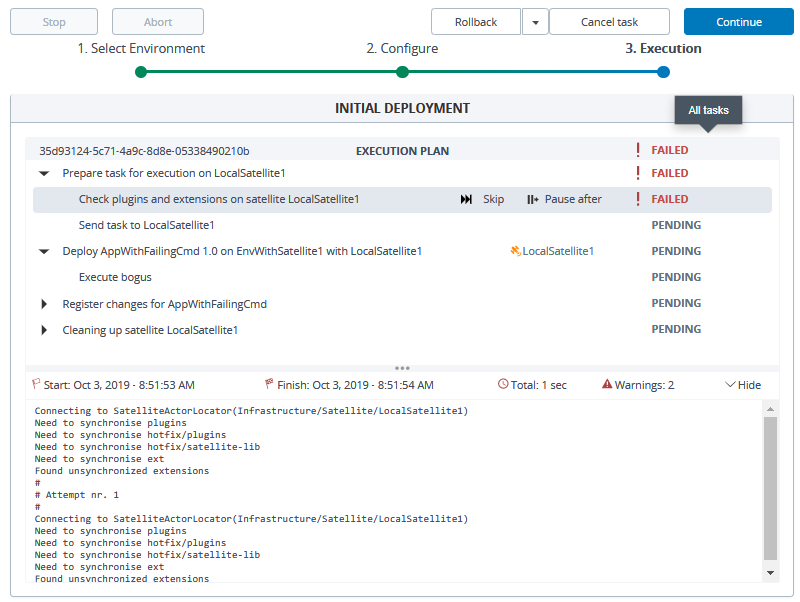
The step log provides details to help you troubleshoot a step with a failed state and also provides a running history of previous step failures during deployment attempts. This history is displayed in reverse-chronological order, with the most recent results displayed at the top of the log and previous attempts separated with # Attempt nr. 1, # Attempt nr. 2, and so on.
In the following example, two attempts were made on an initial deployment of an application to an environment called EnvWithSatellite1.

In this example, if you click the failed step (Check plugins and extension on satellite LocalSatellite1) the step log displays the current attempt at the top of the log, followed by the previous attempt (denoted by # Attempt nr. 1). If you had made additional attempts, they would be displayed and denoted with an attempt number as well. You can use this information to help determine what caused the step to fail, make adjustments, and try the deployment again.
Step log storage using Elastic Stack
Starting with version 9.5, step logs for deployments that are executed on worker nodes can now be stored in Elastic Stack, so log data is not lost if a worker fails. In previous Deploy versions, step logs were stored on the worker node itself, so they were unavailable if the worker crashed.
Digital.ai already recommends setting up the Elastic Stack to monitor log files as part of a production setup. If you choose not to implement this configuration, Deploy will continue to store step log data in memory. All task specification data will continue to be available as long as the worker is running.
You can also setup monitoring of step logs with Elastic Stack while using a satellite for external storage. See Configuring satellite
Compatibility
Deploy uses the Elasticsearch REST API and supports Elasticsearch version 7.3.x and its compatible versions.
Data structure
The data structure for records in Elasticsearch can be aggregated by Task ID (taskId) and Failure Count (failureCount).
The @timestamp field is used for ordering of messages.
Configuration
Once the Elastic Stack is in place, you can edit the deploy-task.yaml to identify the endpoint URL and configure an optional index name.
In a high availability configuration that includes multiple masters and workers, ensure that the following configuration exists on each host:
- Identify the Elastic Stack end point by setting the
deploy.task.logger.elastic.uri="http://elk-url"in theXL_DEPLOY_SERVER_HOME/conf/deploy-task.yamlfile. - Optionally, configure an index name by setting the
deploy.task.logger.elastic.index="index_name". If no value is provided, the default value isxld-log. - Restart Deploy on each master and worker.
- Refer to the Elastic Stack documentation for using the software.
Steplist
A steplist is a sequential list of steps that are contributed by one or more plugins when a deployment is being planned.
All steps in a steplist are ordered in a manner similar to /etc/init.d scripts in Unix, with low-order steps being executed before higher-order steps. Deploy predefines the following orders for ease of use:
- 0 = PRE_FLIGHT
- 10 = STOP_ARTIFACTS
- 20 = STOP_CONTAINERS
- 30 = UNDEPLOY_ARTIFACTS
- 40 = DESTROY_RESOURCES
- 60 = CREATE_RESOURCES
- 70 = DEPLOY_ARTIFACTS
- 80 = START_CONTAINERS
- 90 = START_ARTIFACTS
- 100 = POST_FLIGHT
Steplist order for cloud and container plugins
This is an alternative set of ordering steps for cloud and container plugins.
| Destroy | Create |
|---|---|
| 41-49 | 51-59 = resource group / project / namespace |
| 21-40 | 60-79 = low level resources -> network/storage/secrets/registry |
| 61 = create subnet | |
| 62 = wait for subnet | |
| 63 = create network interface | |
| 29 | 70 = upload files/binaries/blobs |
| 22 | 78 = billing definition |
| 11-20 | 80-89 = vm / container / container scheduler / function resources |
| 1-10 | 90-99 = run provisioners |
| 0 | 100 |
The basic rules:
- Assign the same order for items that can be created in parallel (network/storage).
- Wait steps should be incremented + 1 in according to their create step.
- Destroy = 100 - create.
- Modify similar to create.
- Do not use 50 because does not have a symmetrical value.
- 0 and 100 are reserved.