Reports Dashboard
This topic provides key information on flagged releases and highlights those with the highest level of automation.
The data for this report comes from the Release archive database. Releases that are completed but not yet archived do not appear in reports.
To access the reports dashboard:
- From the left navigation pane, under Reports, click Dashboards.
- Click Summary.
- Select a time period such as "Last 6 months" or a enter a specific date range.
- In the Filter by title... field, enter a release title.
These fields use autocompletes from a database of a maximum of 500 tags.
- In the Add a tag... field, enter release tags.
You can also export the dashboard reports as PDF. To export the reports as PDF, click Export page as PDF.
Release information tiles
- Completed releases: The number of completed releases and the number of templates used to start the releases.
- Longest task type: The type of task that has the longest duration and the number of releases where the task is present.
- Avg. release duration: The average duration of a release and the longest duration of a release.
- Avg. task duration: The average duration of a task and the longest duration of a task.
Task efficiency and time spent
The Task efficiency chart displays the percentages of automated tasks and manual tasks out of the total number of executed tasks. The Time spent chart displays the percentages of time spent for automated tasks and manual tasks out of the total number of days.
Release efficiency
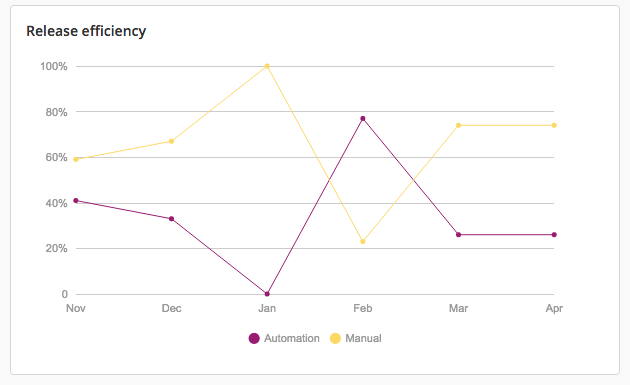
The Release efficiency section displays a graph that provides an overview of the overall level of automation during the selected time period. It shows the following information about completed releases in the selected time period:
- Total numbers of tasks and time spent.
- A comparison of the percentage of automated tasks and manual tasks.
- A comparison of the time spent on automated tasks and manual tasks.
Average release duration over time
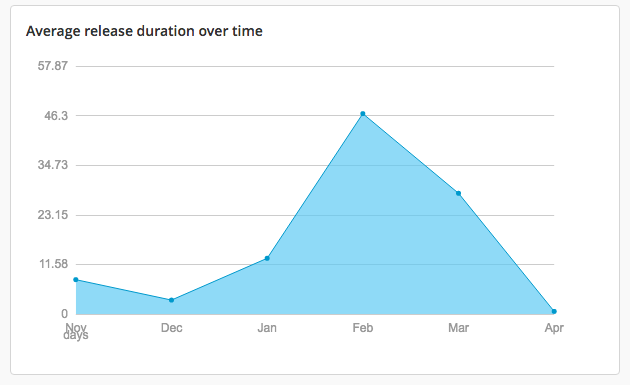
The Average release duration over time section is used to assess if your level of automation improved over time, during the selected time period. It shows the percentage of automated tasks in completed releases during the selected time period, aggregated per month.
Number of releases
The Number of releases section shows how many releases were completed in each month in the selected time period.
Top 10 longest releases and phases
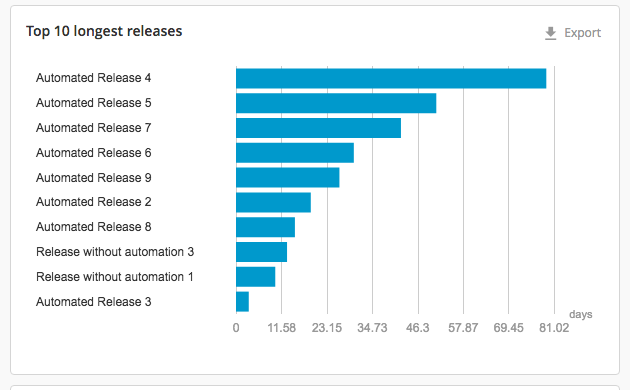
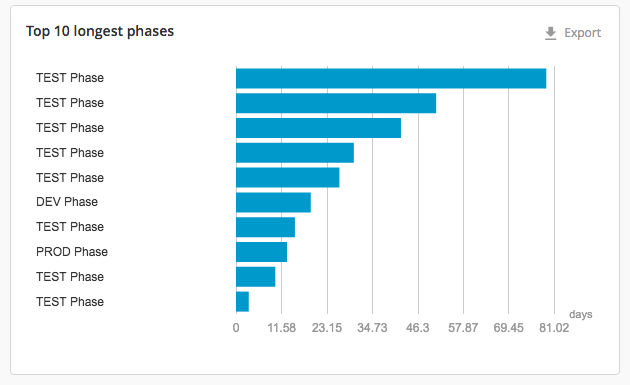
The Top 10 longest Releases section shows the ten releases that were completed in the selected time period that had the longest duration. Top 10 longest phases shows the ten phases from these releases that had the longest duration. Both are shown in descending order.
Click a release name to open it in the release flow editor.
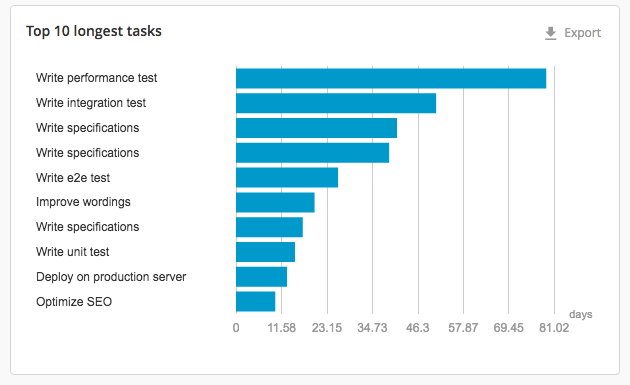
Top 10 longest tasks
The Top 10 longest tasks section shows the ten tasks with status completed or completed in advance in the selected time period that had the longest duration. It also shows the task owner, the most recent assignee.
Top 10 task assignees
The Top 10 task assignees section shows the users who spent the most time and handled the most tasks in the selected time period. To calculate this, Release groups the tasks with status completed or completed in advance by owner (the most recent assignee), calculates their durations, and sorts them in descending order.