Prevent Defect Leakage dashboard
The Prevent Defect Leakage dashboard enables you to identify and prevent defects from leaking into your production systems. Addressing defects early is crucial as the cost of fixing them increases over time. Eliminating defects in the early stages enhances the efficiency of the delivered product. This dashboard is specifically designed for analyzing primary defects.
Project Managers can use this dashboard to examine their projects, analyze their preproduction defect backlog, and ensure high-priority and medium-priority defects are addressed promptly. Business Unit Heads can also review the defect backlog across all their projects. This dashboard also helps ensure that critical defects do not reach production.
As a Scrum Master, you can find answers to some of the key business scenarios such as:
- Number of bugs the teams are reporting, resolving, and closing monthly
- Identify the root cause for defect re-work and eliminate the root cause
- Identify test failure metrics that may indicate a problem that requires further investigation
- Understand pre-production defect backlog and plan to remove high and medium priority defects before deployment
This dashboard is built using the defects by tag, defect details, defects trend by month, project iteration details, workitem time spent, Teamforge last refresh date and Teamforge security datasets.
The Last refresh date on this dashboard refers to the date and time when the data displayed on the dashboard was last updated or refreshed from the underlying data sources. You can know the data’s freshness and make informed decisions based on the most recent information.
The Prevent Defect Leakage dashboard displays data in five separate tabs. Each tab provides detailed information about defects identified by the system. The five tabs are:
- Overview
- Defect removal efficiency
- Reopened defect
- Defect prevention
- Defect backlog
Overview
The Overview tab gives you insights into the overall defect projection. The KPI displayed on the tab is the average of Defect Removal Efficiency %, Reopen Defect %, Defect Prevention %, and Defect Backlog %.
Here is an example panel in the overview tab:
The Overview tab has the following distinct panels:
Recommendations: This panel on top of the dashboard gives recommendations for the top three projects where there are opportunities to reduce defect leakage.
Defect projection by project: This panel displays a list of projects with defect related metrics to help understand the overall status, such as Defect removal efficiency %, all currently open defects, Defect growth%, number of defects reopened, and Opportunity rank overview.
Defect removal efficiency % helps you understand the number of primary defects fixed versus the number of defects reported, in the current month and completed 6 months. The Defect growth % metric helps you understand the growth percentage of defects in the last three months in comparison with the three months before that. Opportunity rank overview is a metric that helps you understand which project needs to be addressed on priority to improve the overall defect removal efficiency and is calculated by ranking each metric across a Project or Team; the ranks are then summed to derive the opportunity rank. A lower rank signifies scope for improvement.
You can choose to view data in this grid based on Projects or Team by clicking the required tab within this panel.
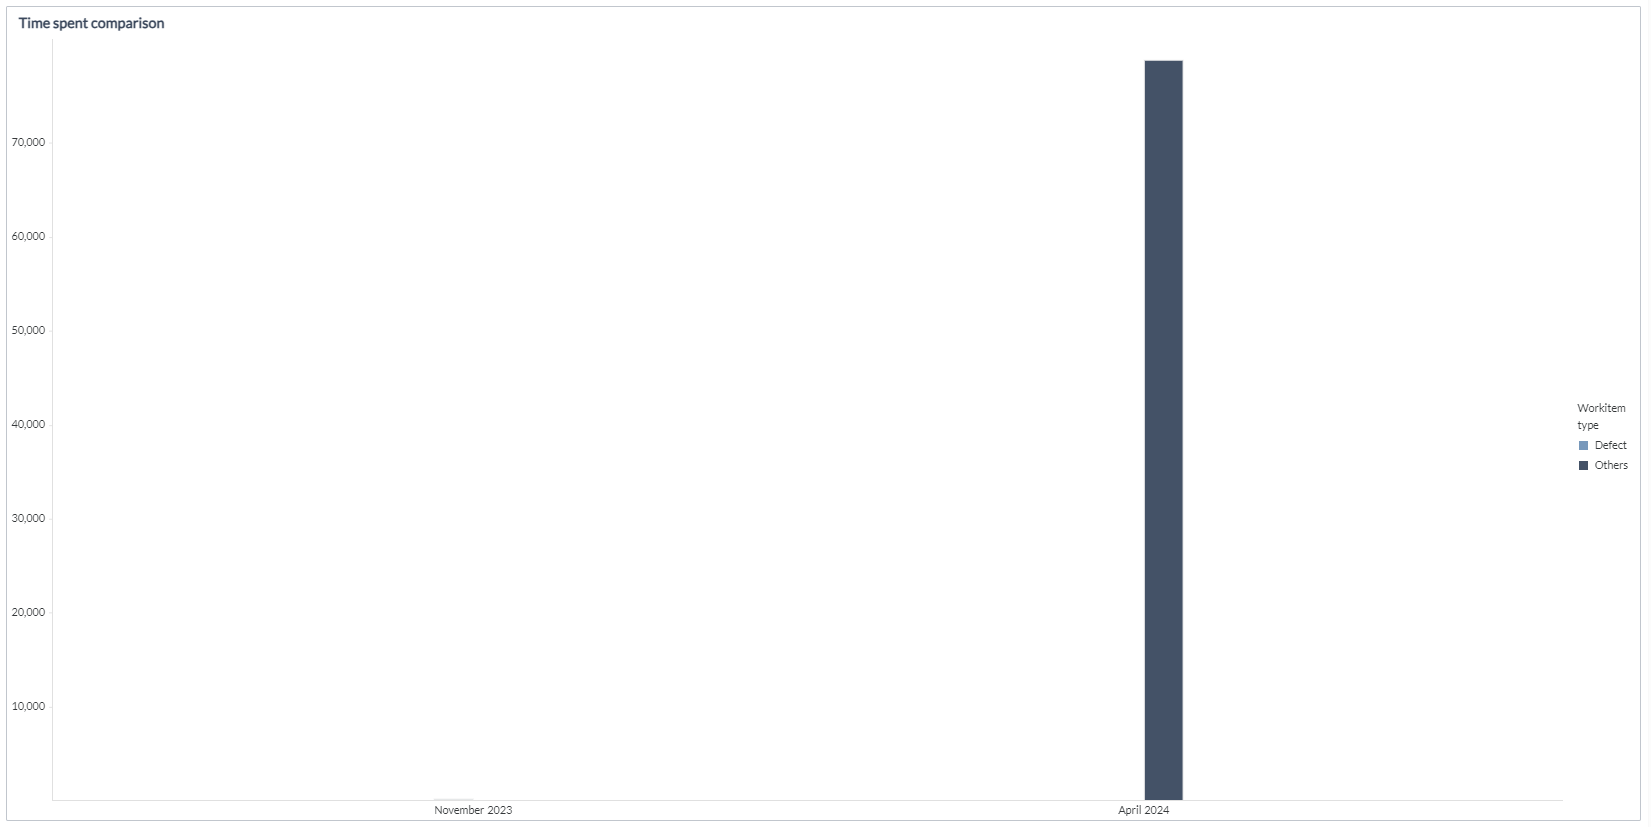
Impact of defect removal efficiency on flow: This panel displays a bubble graph to help you analyze the impact of defect removal efficiency on the project. The Average duration in progress to completed in days is plotted against Defect removal efficiency % to display this data. The size of the bubble indicates the number of defects reported. The bigger the bubble means more defects are reported. Hence, the project needs more attention. Time spent comparison: The Time spent comparison panel is primarily meant for analyzing time spent on primary defects. This panel displays a bar graph for time spent on new feature (based on primary requirement) development versus defect fixing, month-wise. Data is displayed for the current month and completed 6 months. Refer to the legend on the user interface to know more about what the bar color indicates. Hover over the bar to view the tooltip detailing the project metrics such as Total time spent hours, Effort updated date, and Work item type.
Defect removal efficiency
This tab gives you specific details about the defect removal efficiency metrics. The KPI on the tab is an average of Defect removal efficiency % across all projects. Here is an example panel in the Defect removal efficiency tab:
The Defect removal efficiency tab has the following distinct panels: Recommendations: This panel on top of the dashboard gives recommendations for the top three projects where there are opportunities to reduce defect removal efficiency.
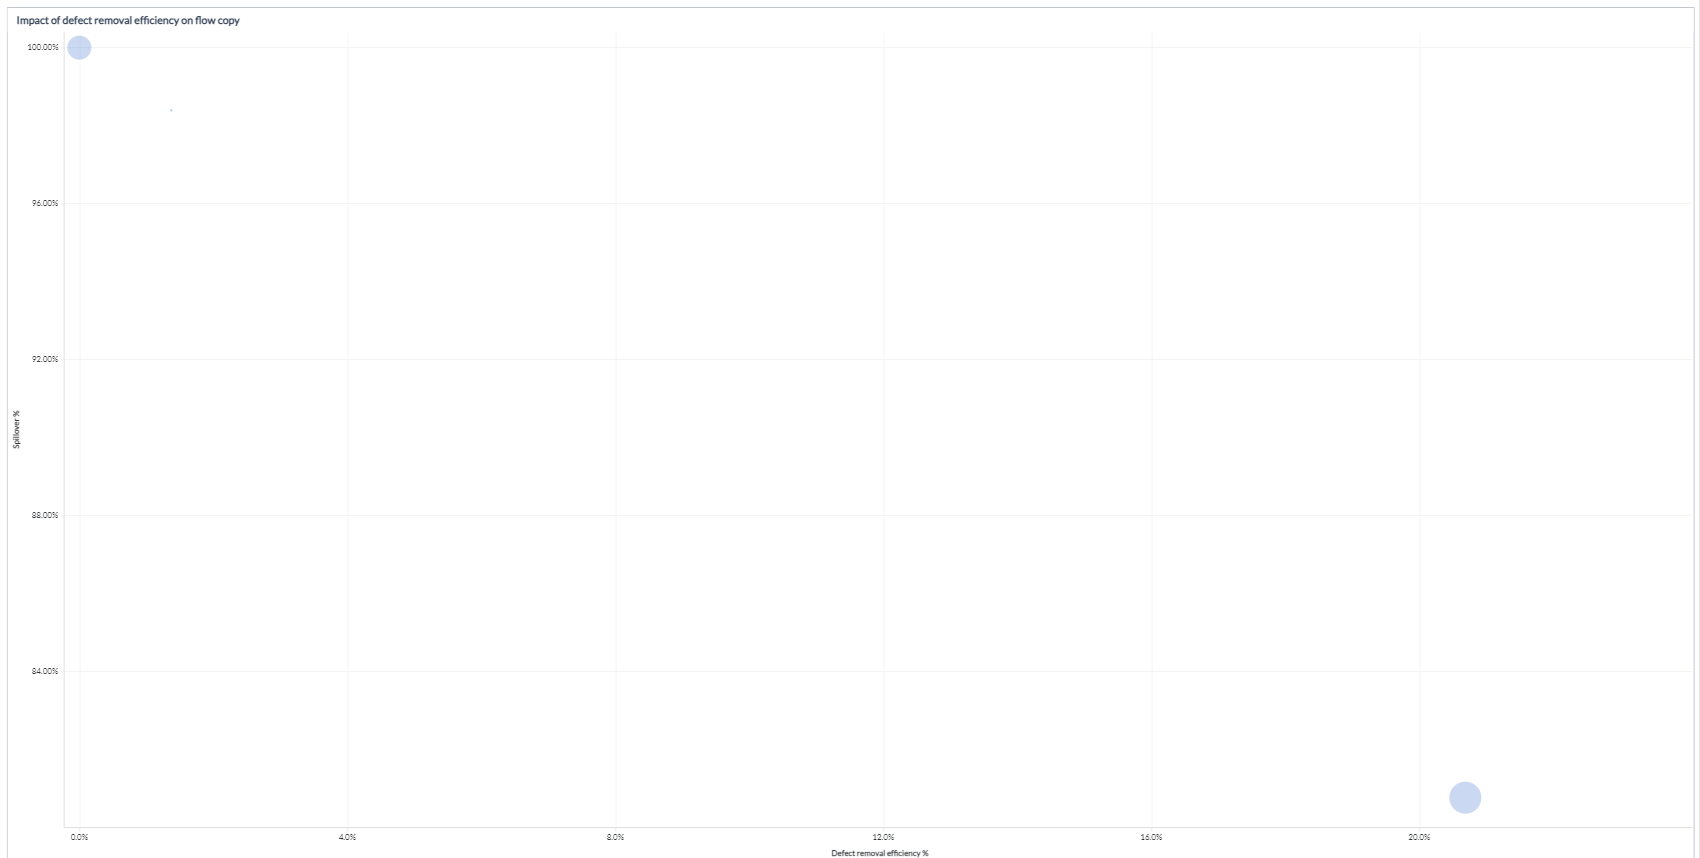
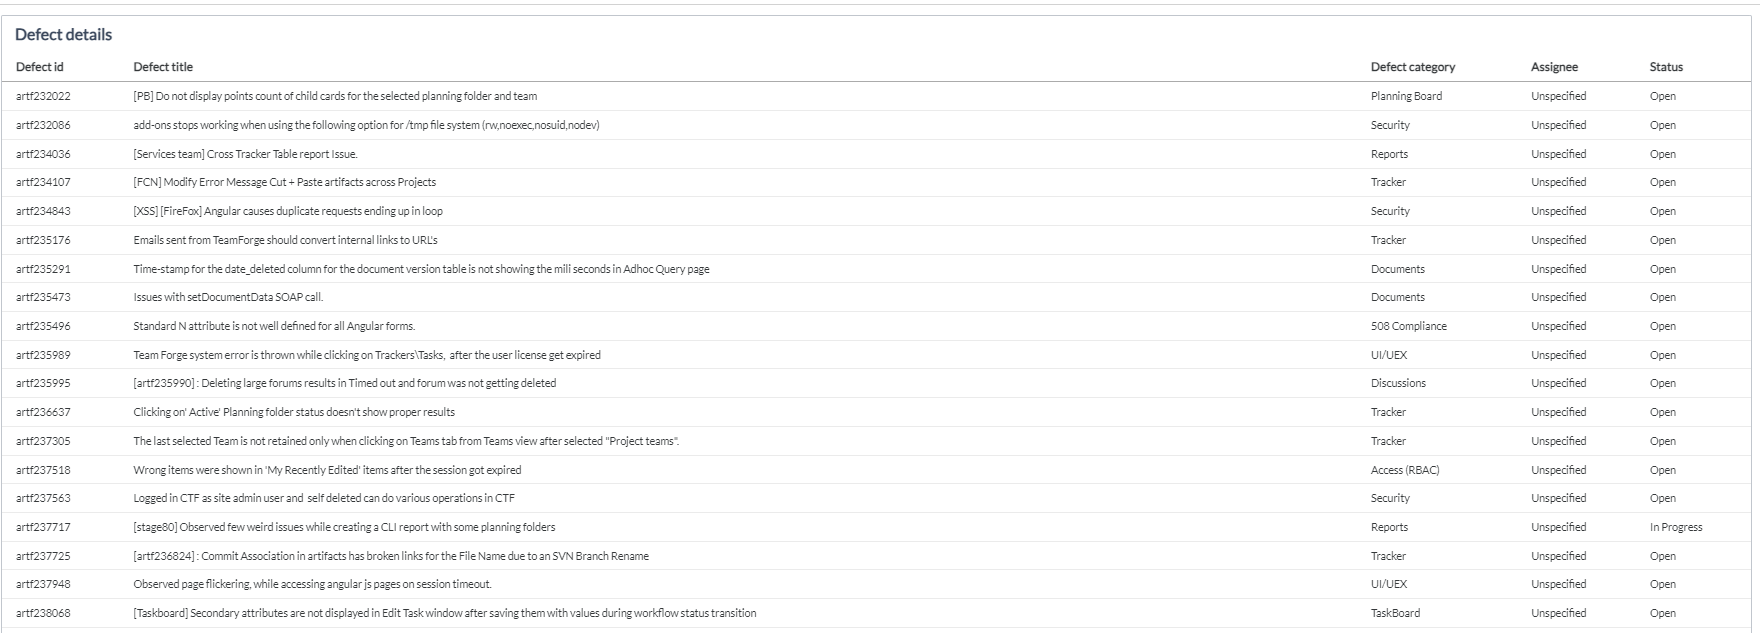
Defect projection by project: This panel lists out all projects with their Defect removal efficiency %, number of defects reported, number of defects fixed, and Opportunity rank defect removal efficiency. You can tab across to the Team tab within this table to view these metrics for Teams. Impact of defect removal efficiency on flow: This panel displays a bubble graph to help you analyze the impact of defect removal on the project. Work item spillover % for requirement work items is plotted against defect removal efficiency to display this data. The size here indicates Average defect priority. You can hover over the graph for the tooltip to view details like the number of defects reported, project, defect removal efficiency, spillover percentage, and average defect priority. Defect details: This panel displays a list of defects with specific details such as defect ID, defect category, and title of the defect.
Reopened defect
The Reopen Defect tab provides information about primary defects (primary defect work item type) that were reopened in the current month and the last six months and enables you to analyze the reopened defects from a project or team level. You can view the trend of reopened defects and understand their impact on the project and iterations.
Here is an example panel in the Reopened defect tab:
The Reopened defect tab provides the following sections: Recommendations: Displays recommendations for projects that are associated with the top three opportunity ranks. Prioritizing on reducing reopened defects across these projects can bring down the defect reopened percentage. Reopened defects projection by project: Displays a grid panel with details about reopened defects categorized based on project or team. You can click the Project or Team tab to view the required information. Only projects that have at least one reopened defect are considered. This grid shows the following details:
- Reopen defect %: Displays the percentage of primary defects that are reopened as compared to the fixed defects.
- Reopened defects: Displays the total number of primary defects that are reopened.
- Reopened defects Growth %: Percentage growth of reopened defects in the last 90 days as compared to before the last 90 days.
- Opportunity rank reopened defects: Displays the opportunity rank calculated by ranking each metric reopened defect %, reopened defects, and growth % across a project or team; the ranks are then summed to derive the opportunity rank. A lower rank signifies scope for improvement. You can click a particular project, team, or value in the grid to drill down and view only relevant data in the subsequent panels.
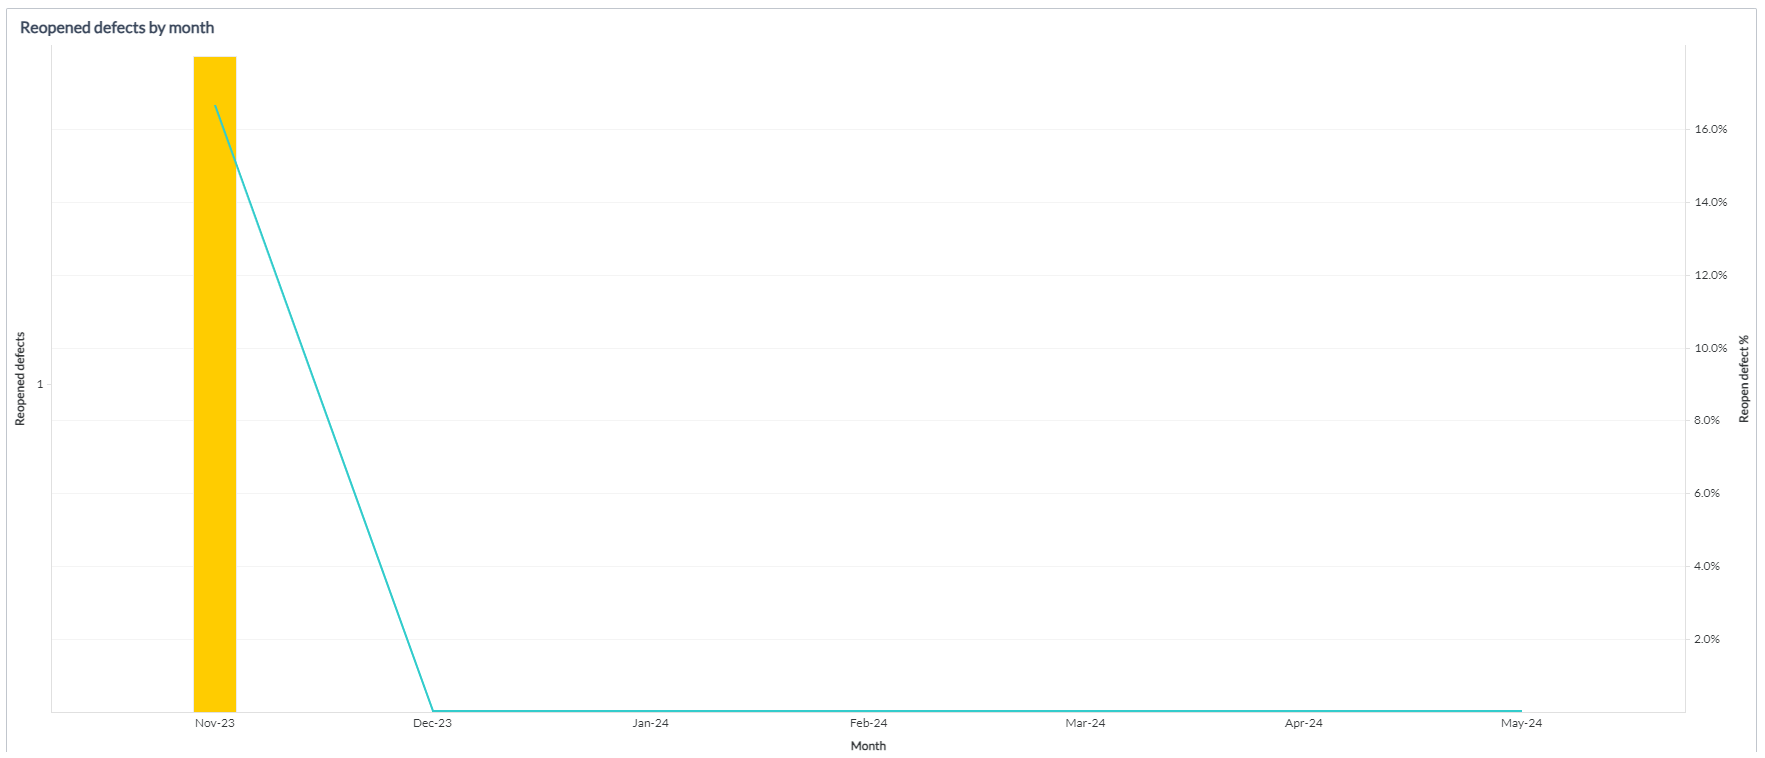
Reopened defects by month: Displays a combination chart to denote reopened defects across months. The bar graph indicates the total number of reopened defects and the line graph represents the percentage of reopened defects. Defect reopen % by category: Displays the percentage of reopened defects based on the defect category. Impact of reopened defects: Displays two bubble charts that denote the impact of reopened defects measured by the number of defects that were carried into the next iteration and by the number of committed defects that were delivered. The bubbles are grouped by work item iterations and their size signifies the count of committed defects. Reopened defect details: Displays detailed information about individual defects, such as Defect ID, Defect title, Original close date, Reopened date, Status, and Status class. The data in this grid is driven by selections made in the earlier panels.
Defect prevention
This tab gives you specific details about defect prevention in projects. The tab's KPI is an average defect growth percentage across all projects.
Here is an example panel in the Defect prevention tab:
The Defect prevention tab has the following distinct panels:
Recommendations: This panel on top of the dashboard displays the top three projects where the average defect growth percentage is high.
Defect projection by project: This panel lists out projects with their defect related metrics. The metrics displayed are Defects reported in the current month, the total number of defects in the past three months, the prior three months, and defect projection for the next three months. It also displays Defect growth %, and Opportunity rank defect prevention for projects.
You can tab across to the Team tab within this grid to view these metrics for Teams.
Impact of defect growth on flow (completed 6 months): This panel displays a bubble chart to help you analyze the impact of defect growth on the project. The average duration in progress to completed in days is plotted against an average number of defects reported in a month to display this data. The size of the bubble indicates the Defects removal efficiency %.
Defect Details: This panel displays a list with specific details about defects such as Defect ID, Defect title, Defect category, Assignee, and defect status.
Defect backlog
This tab gives you specific details about the defect backlog. The KPI displayed on the tab is an average of open defects till date against defects reported in the current month and last 6 months.
Here is an example panel in the Defect backlog tab:
This tab has the following distinct panels:
Recommendations: This panel on top of the dashboard displays the top three projects with the highest number of open defects.
Defect projection by project: This panel lists projects along with specific defect related metrics. The metrics displayed are the number of open defects, the average age of corresponding open defects, Percentage to total number (of the number of open defects), and opportunity rank defect backlog for projects.
You can tab across to the Team tab within this grid to view these metrics for Teams.
Opportunity Rank is a metric that helps you understand which project needs to be addressed on priority to improve the overall defect removal efficiency. The higher the opportunity rank, the greater the chances of increasing quality by working towards defect reduction.
Defect by labels: This panel displays a heat map to help you analyze the defects based on the category. Hover over the heat map to display the tooltip with details about the defect category, the number of defects reported with that particular category, and the average open defect priority. The color intensity of the block defines the average priority of defects tagged to a defect category.
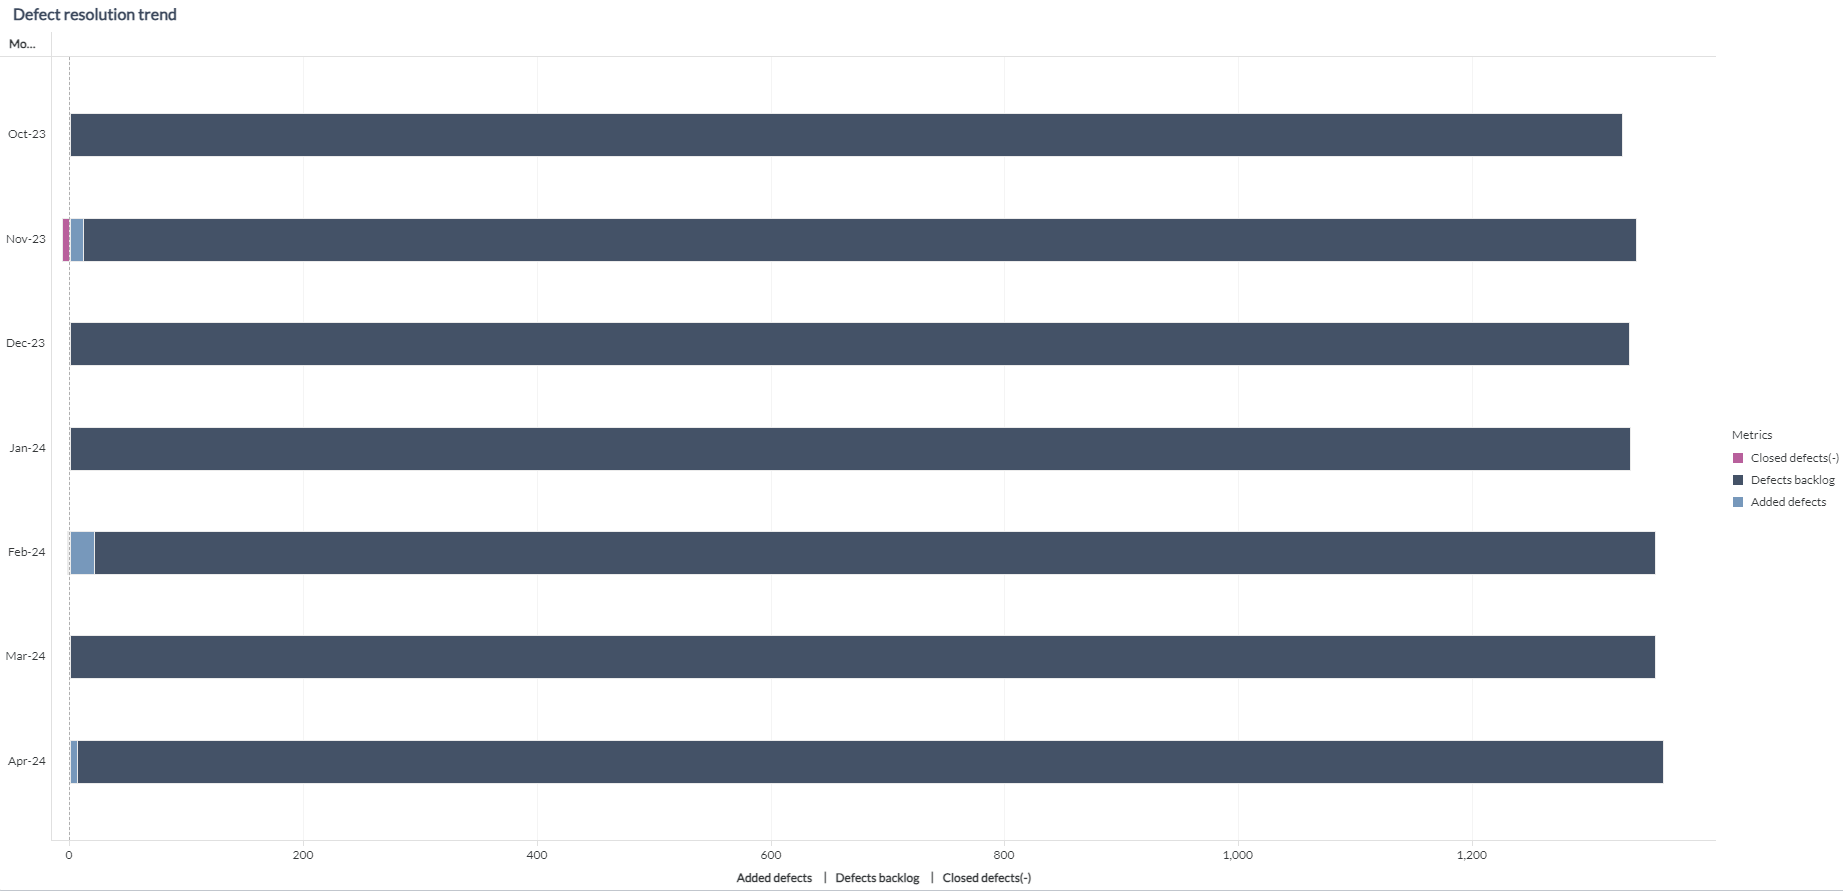
Defect resolution trend: This panel displays a bar graph to help you analyze the trend in defect resolution, month-wise. Refer to the legend on the user interface to know more about defects added, defects closed, and the defect backlog. Data is displayed for the current month and completed 6 months.
Defect details: This panel displays a list with specific details about defects such as Defect ID, Defect title, Defect category, defect priority, Assignee, and Defect age.
Components used in this dashboard
The following components of the dataset are used in this dashboard:
Attributes
| Attribute Name | Description |
|---|---|
| Assignee | The team member to whom the defect is assigned |
| Defect category | Category of the defect |
| Defect ID | ID of the defect |
| Defect title | Title of the defect |
| Month | Gregorian calendar month displayed in the format 'Mon YYYY' |
| Priority | Priority of the defect |
| Project | The project with which the defect is associated |
| Status | Status of the defect |
| Status class | Status class of the defect |
| Tag | Organize defects around keywords |
| Team | The team to which the defect is assigned |
| Work item type | Type of the work item |
Metrics
| Metric Name | Description | Formula |
|---|---|---|
| Added defects | Defects newly reported in the current period | Count[Added defects] |
| Average defect age | Average age of all defects | Avg([Defect age]) |
| Avg defect priority | Average priority of all defects | Mode(Priority) |
| Average monthly defects created | Average number of defects created in a month | [Added defects]/6 |
| Average work start to closed duration | Average time taken to resolve a defect | [Work start to closed duration]/[No of defects] |
| Closed defects | Count of all closed defects | Count[Closed defects] |
| Committed count | Count of story points committed at the beginning of the project | Count (Committed story points) |
| Committed vs delivered % | Percentage of work items that were committed for completion as compared to work items that were completed | (Completed count/Committed count) |
| Defect age | Age of the defect (from the time created to current date) | Close Date (or Latest Data Refresh Date) - Created Date |
| Defect removal efficiency % | The number of fixed primary defects over the last 7 months relative to the total number of primary defects reported over the last 7 months | [Fixed defects]/[No of defects] |
| Defects backlog | Number of defects in the backlog | Count[Defects backlog] |
| Defects reported in current month | The number of defects reported in the current month | Count(Defects reported in current month) |
| Defects reported in past 3 months | The number of primary defects with lagging count of months between 1 and 3 | Count(Defects reported in past 3 months) |
| Defects reported in prior 3 months | The number of primary defects with lagging count of months between 4 and 6 | Count(Defects reported in prior 3 months) |
| Fixed defects | Total number of defects that are fixed | Count(Fixed defects) |
| Lead time | Time difference between defect start date and defect created date | Close Date − Created Date. If Close Date is missing → Age = 0 |
| Number of defects | Total number of defects | Count(Defects) |
| Open defects | Total number of primary defects that are open | Count[Open defects] |
| Opportunity rank defect backlog | It ranks items by combining the ranks of open defects and the percentage they contribute to the total. Lower combined scores get better ranks. | Rank/< ASC=True/ >(([Rank open defects]+[Rank percent to total (Open defects)])) |
| Opportunity rank defect prevention | It ranks items by combining the ranks of defects reported in the past 3 months and defect growth percentage. Lower combined scores get better ranks. | Rank/< ASC=True /> (([Rank defects reported in past 3 months]+[Rank defect growth %])) |
| Opportunity rank defect removal efficiency | This formula ranks items based on their defect removal efficiency percentage, with higher values getting better ranks (Rank 1 is the highest efficiency). The ranking is done within groups, depending on the dashboard setup. | Rank/< ASC=False/ >([Defect removal efficiency %]) |
| Opportunity rank overview | This formula combines four defect-related rankings into one total score and then ranks the results across all entities (for example, projects or teams) in ascending order, so the best-performing entity in terms of quality gets Rank 1. | Rank/< ASC=True/ >(((([Opportunity rank defect backlog]+[Opportunity rank defect removal efficiency])+[Opportunity rank defect prevention])+[Opportunity rank reopen defects])) |
| Opportunity rank reopen defects | It ranks items based on reopened defect metrics. It combines ranks for reopened defects, reopen defect percentage, and growth in reopened defects. Lower combined scores get better ranks. | Rank (ASC=True): ((([Rank reopened defects] + [Rank reopen defect %]) + [Rank reopened defects growth %])) |
| Overview % | It shows the average of four defect metrics: defect removal efficiency, reopen defect %, defect growth %, and defect backlog %. It gives a quick view of overall defect health. | ([Defect removal efficiency]+[Reopen defect %])+[Defect growth %]+[Defect backlog %]/4 |
| Percentage to total (Open defects) | the percentage of open defects each item contributes to the total open defects. | Open defects/Total open defects |
| Projected defects - next 3 months | The projected number of primary defects for the next three months, which is a product of average primary defects in the last 3 months and the defect growth % | [Defects reported in past 3 months]+([Defects reported in past 3 months]*[Defect growth %]) |
| Reopen defect % | Percentage of defects that are reopened as compared to fixed defects | [Reopened defects]/[No of defects] |
| Reopened defect % | Percentage of defects that are reopened as compared to fixed defects | [Reopened defects]/[No of defects] |
| Reopened defects growth % | Growth percentage of reopened defects in the last 90 days as compared to before the last 90 days | ([Reopened defects in past 3 months]-[Reopened defects in prior 3 months])/[Reopened defects in prior 3 months] |
| Reopened defects | Total number of defects that are reopened | Count[Reopened defects] |
| Spillover % | Percentage of work items that have spilled over to the next version of the project | (1-([Completed count]/[Committed count])) |
| Time spent hours | Total time spent on all work items (in hours) | time spent hours |