Manage Dashboards
Dashboards serve as a pivotal component for users to visualize, interpret, and interact with data insights generated by Digital.ai products.
Accessing Dashboards
Dashboards can be accessed in two ways:
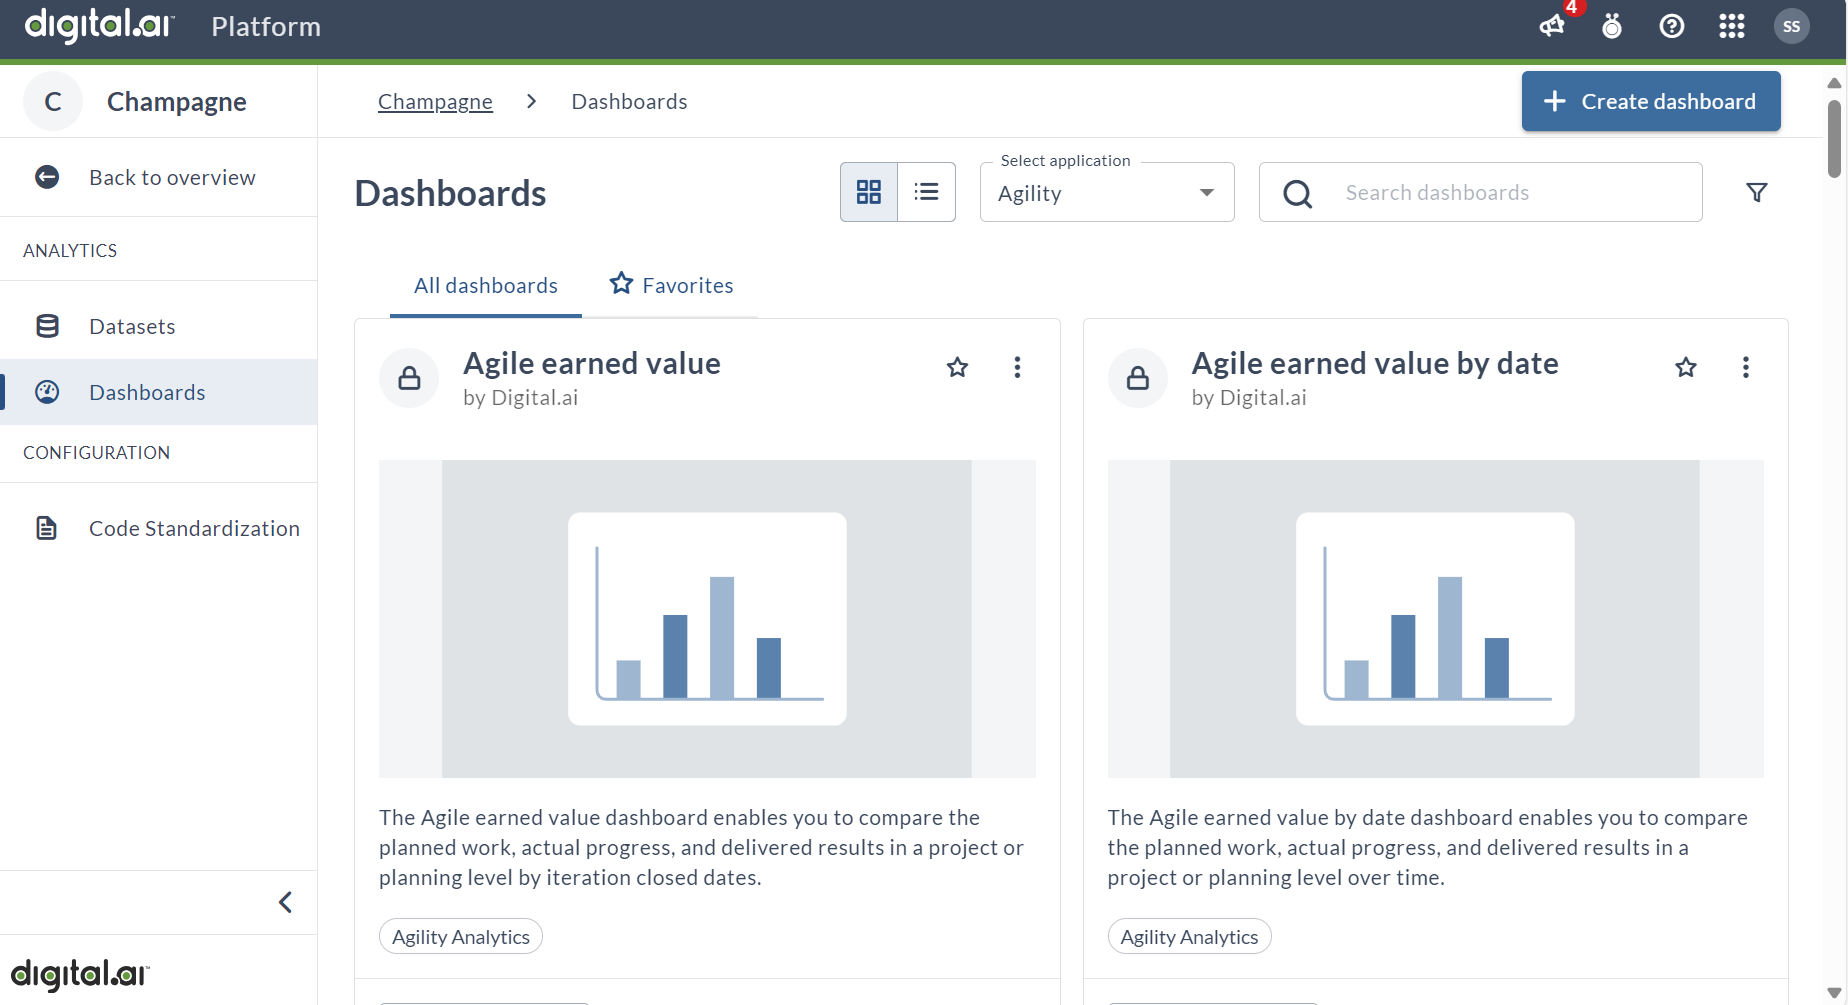
You can access dashboards from the Platform itself.
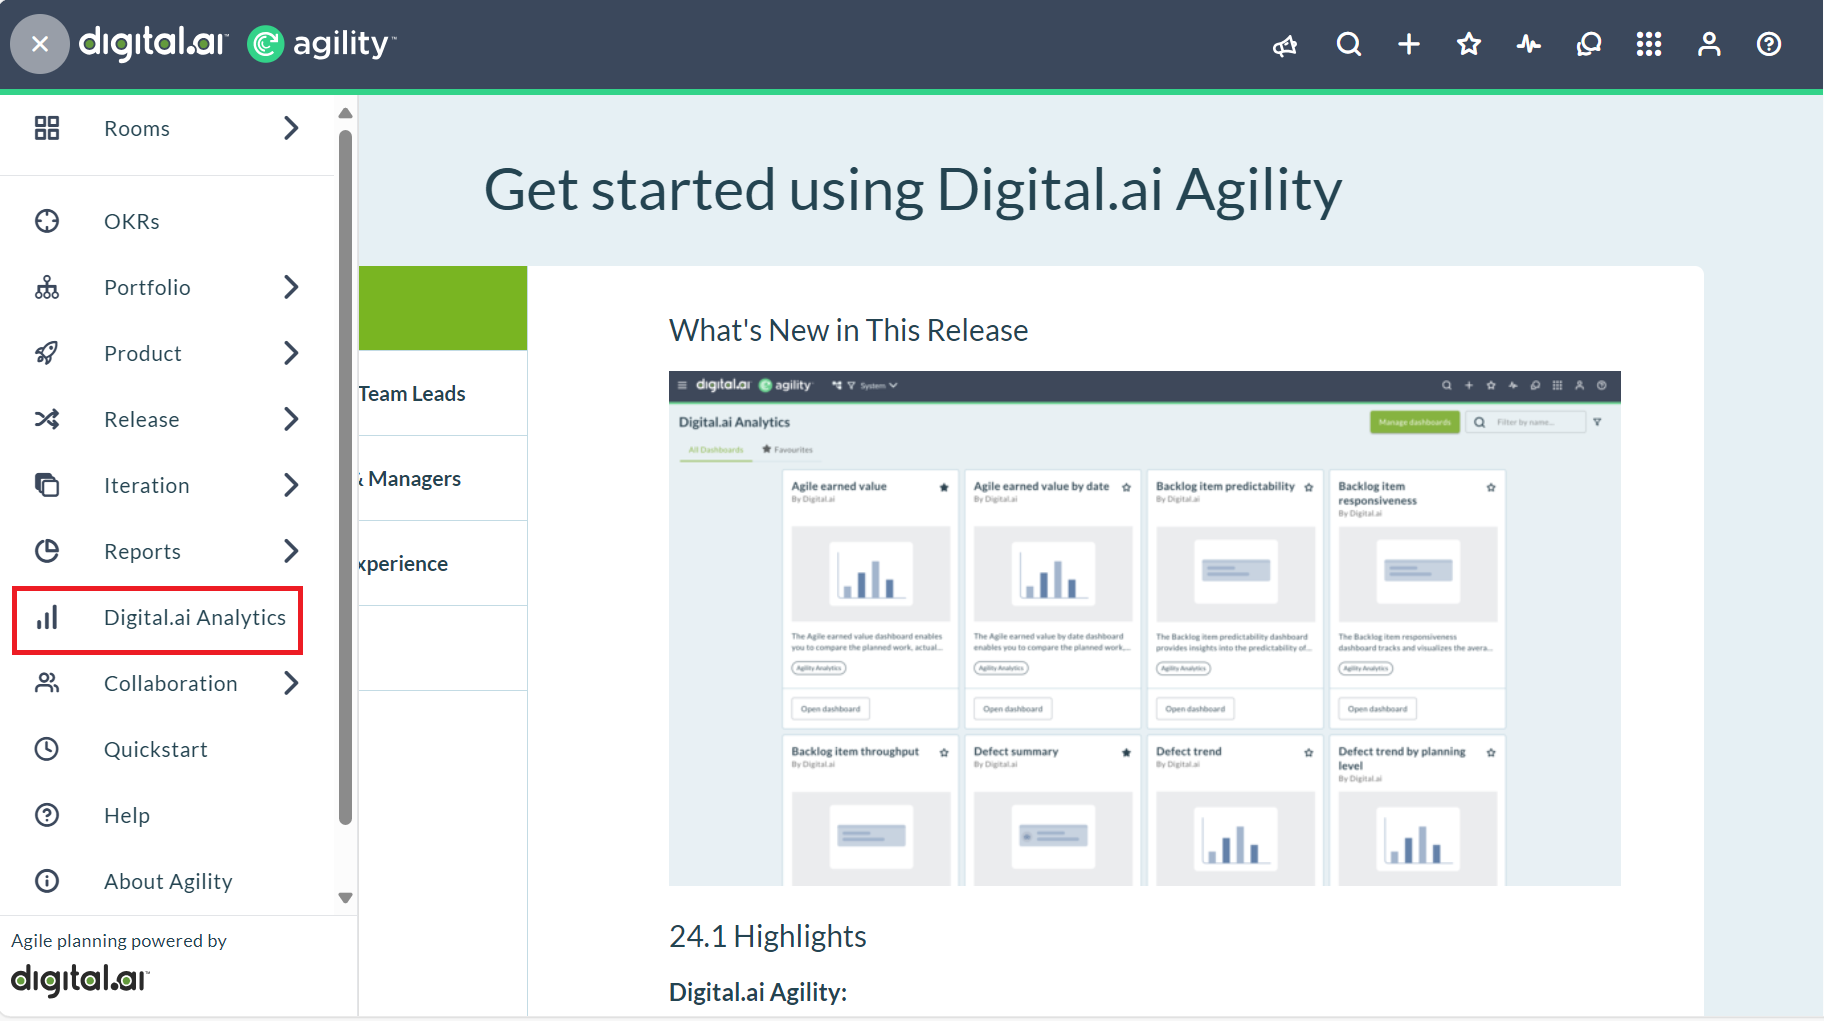
You can also access dashboards that are embedded in the individual Digital.ai products, such as Agility or Release. Click Digital.ai Analytics option in the hamburger menu.
For example, in Agility:
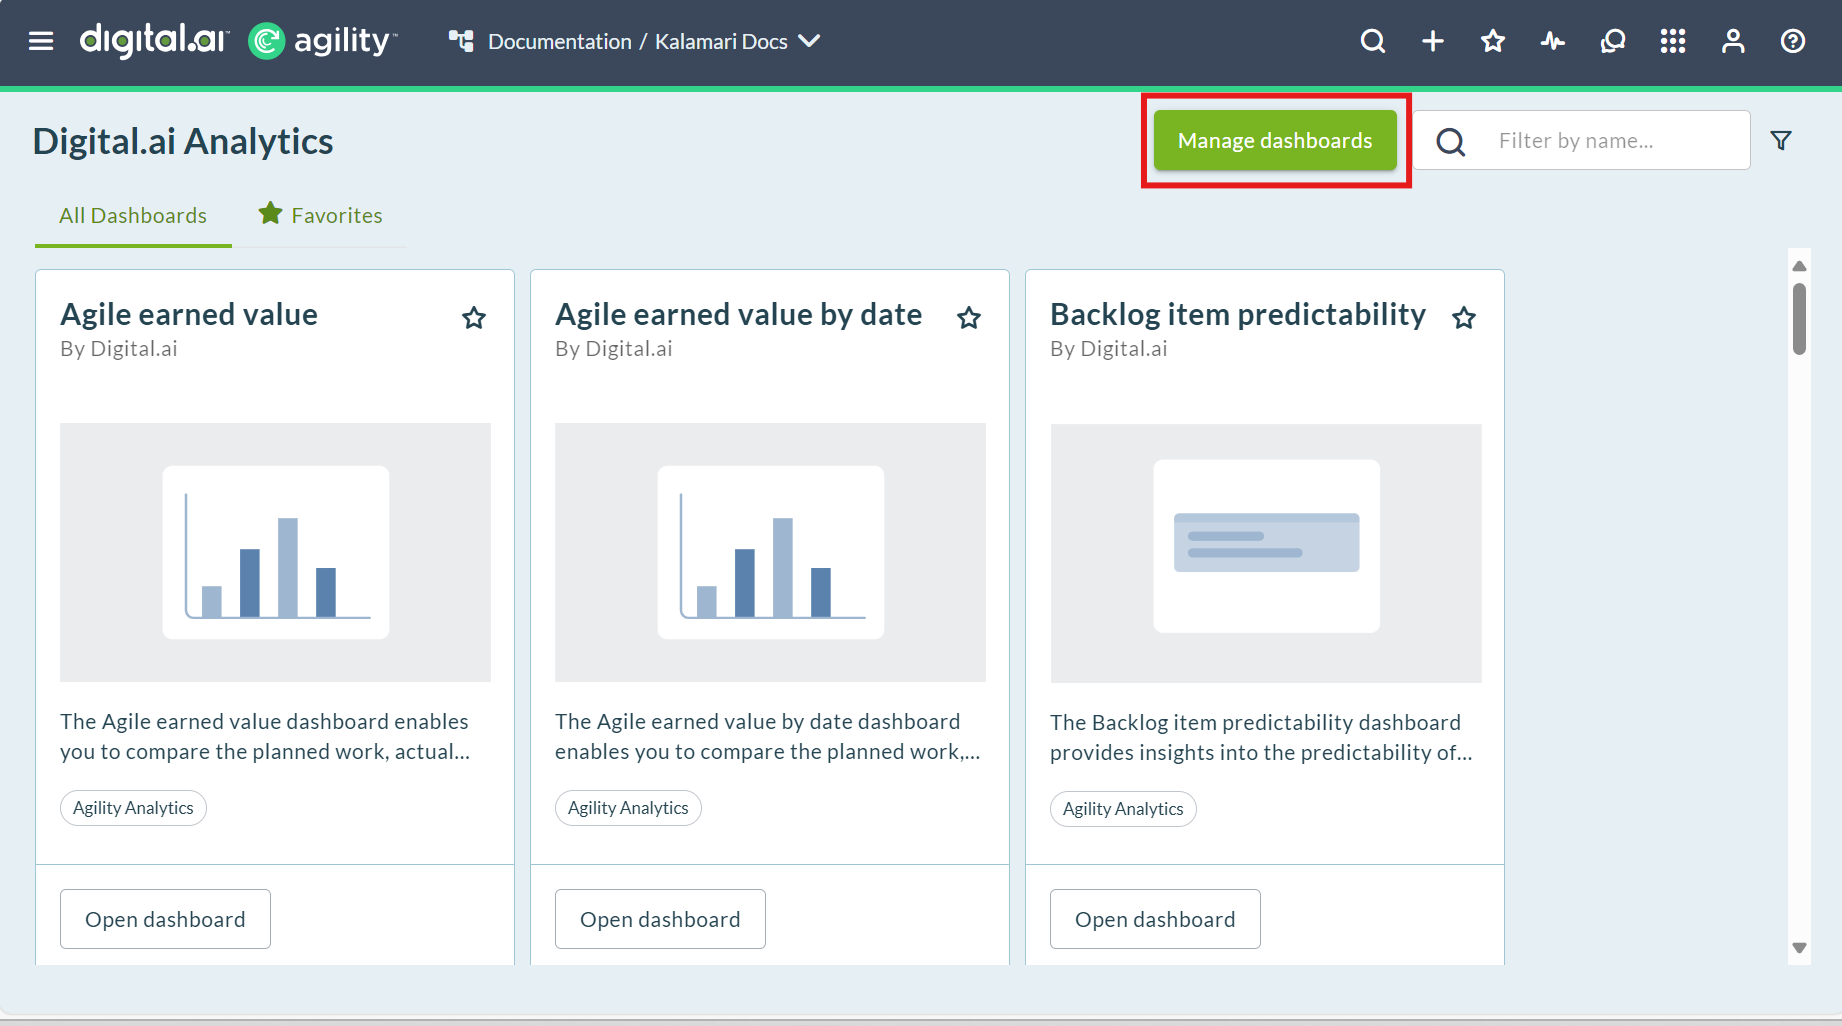
When viewing an embedded dashboard, you can click Manage Dashboards to customize the dashboard.
Depending on whether or not you have configured SSO integration, users may encounter a login screen when viewing a dashboard from the product.
Users with the account-user role can only view dashboards, while users with the account-analytics-author role can edit and create dashboards.
Customize Dashboards
Out of the box dashboards are indicated by the Digital.ai tag directly below the dashboard name. Customers cannot edit or remove these pre-configured dashboards, but can duplicate them for use as a template.
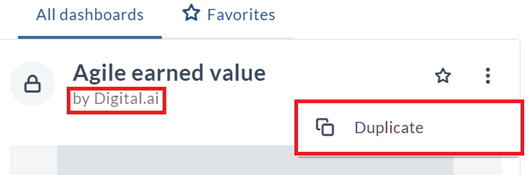
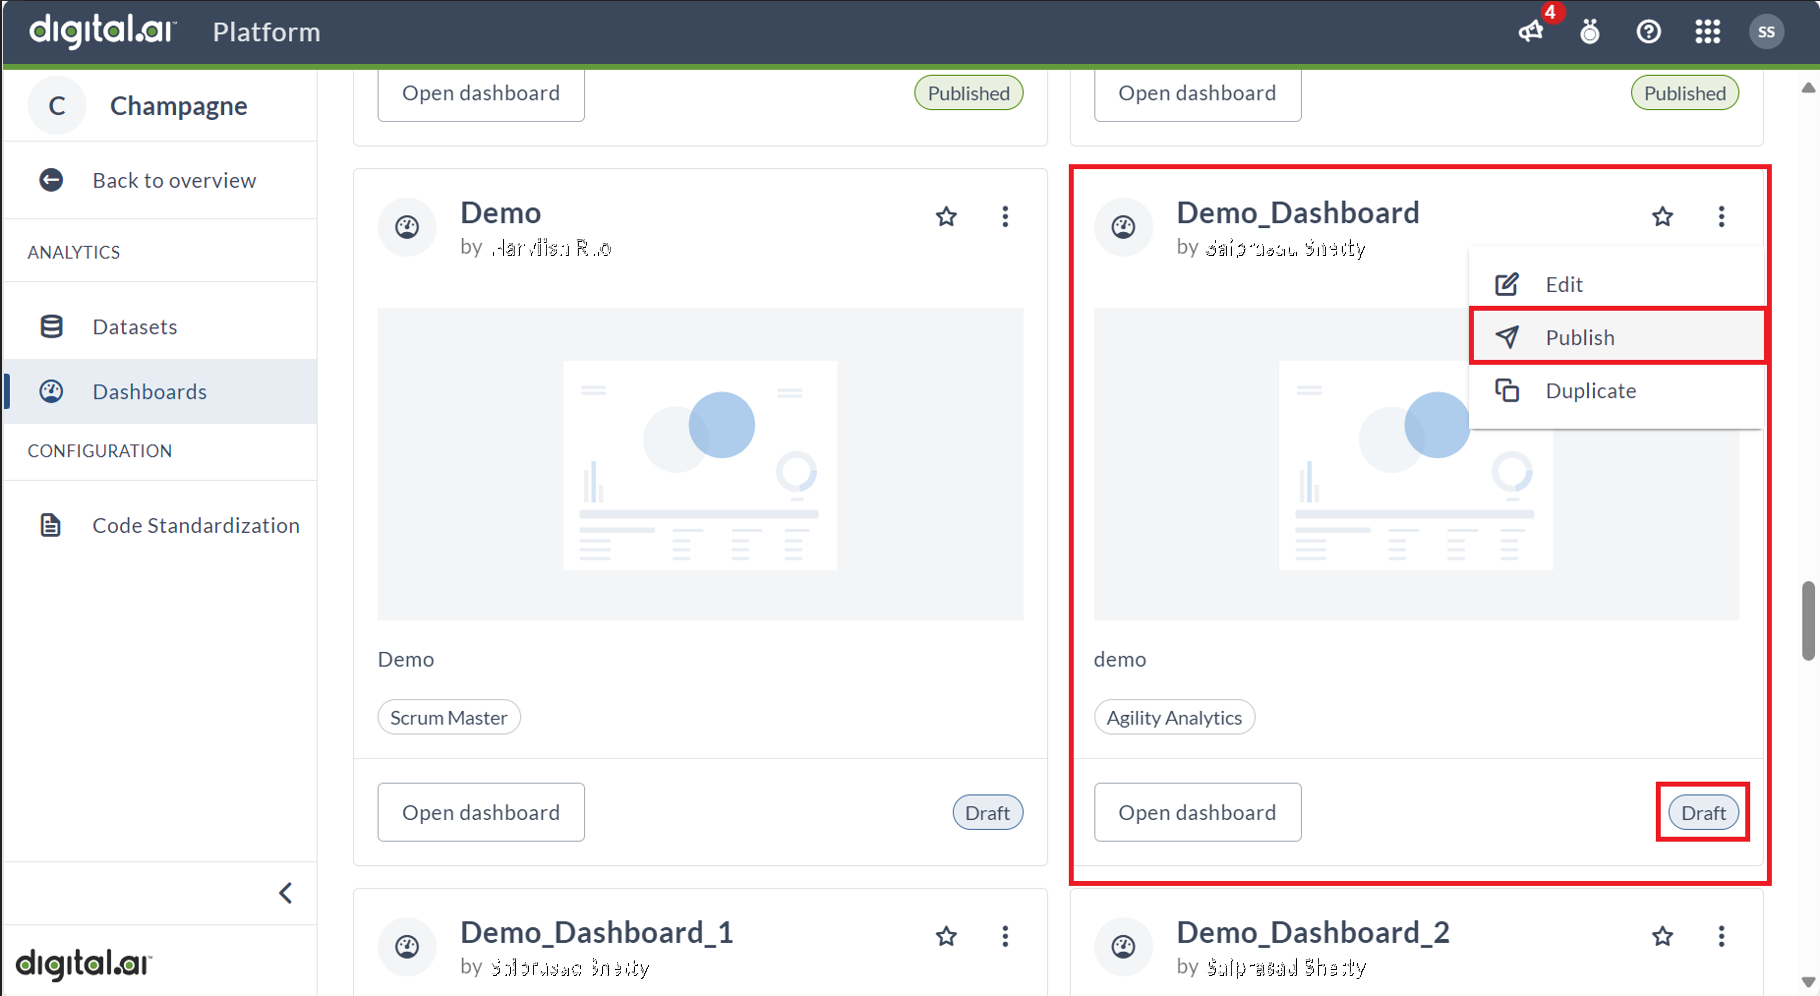
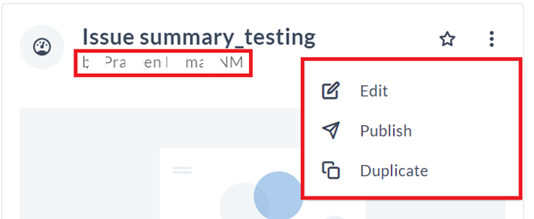
In cases where customization is performed for a customer, the name of the individual who customized it will appear on the dashboard. Additionally, in a customized dashboard scenario, users have the capability to edit, publish, and duplicate the dashboard.
Dashboard Filters
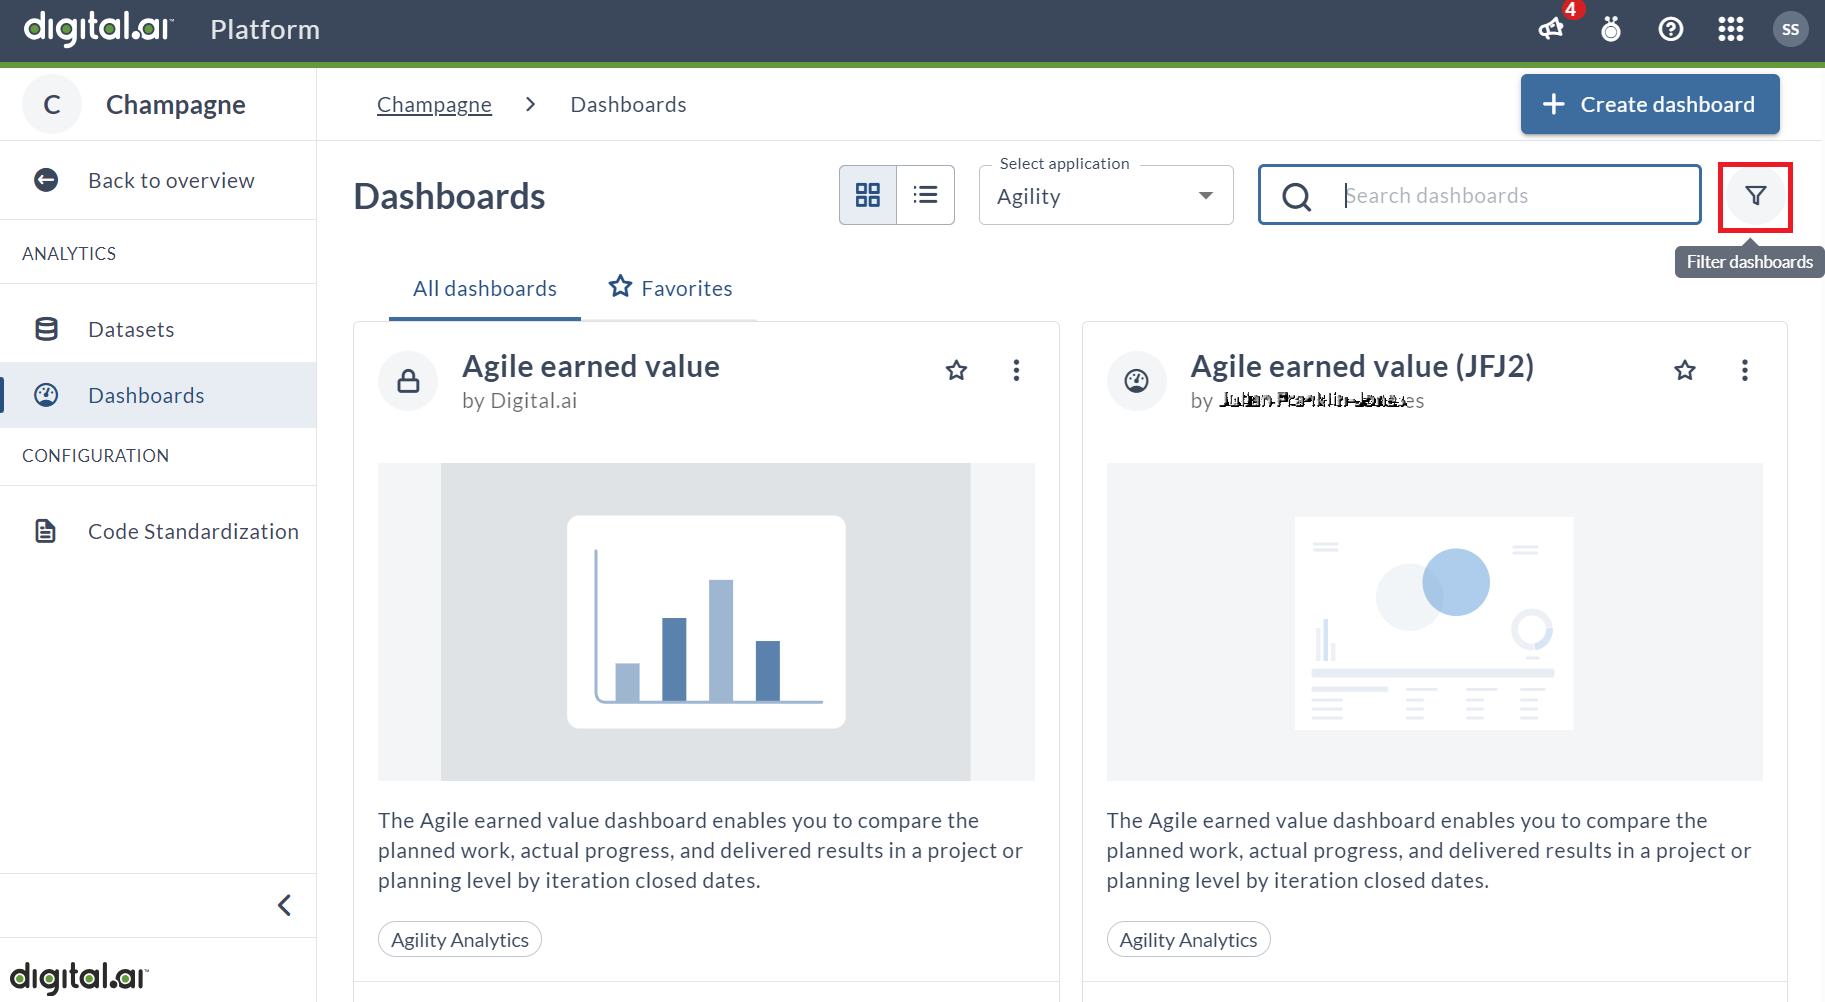
Dashboard filters are applied globally across all panels or widgets featured on a dashboard.
Filter By Author
Filtering dashboards by Author allows users to sort through content based on who customized it. When the dashboard heading includes Digital.ai, it signifies pre-configured offerings provided to customers out of the box. However, in cases of customization, the name of the individual who customized it will be displayed while sorting.
Filter By Category
Filtering dashboards by category helps to tailor insights to specific stakeholders. This is simply a way for grouping dashboards into sets and each set represents the most common use cases of a particular user persona - like Scrum Master, Release Manager etc.
Filter By State
In the dashboard system, there exist two primary states: Draft and Published. By default, upon creation, all dashboards are designated as Draft. The Draft state indicates that work is currently in progress on the dashboard, with ongoing edits, additions, or adjustments being made.
The Published state signifies that the dashboard has been finalized and made ready for consumption by users. Until a dashboard is published, it remains inaccessible to users, ensuring that only completed and verified dashboards are made available for viewing. This distinction between Draft and Published states serves to streamline the dashboard development process, allowing for thorough review and refinement before sharing it with users.
Dashboard Creation
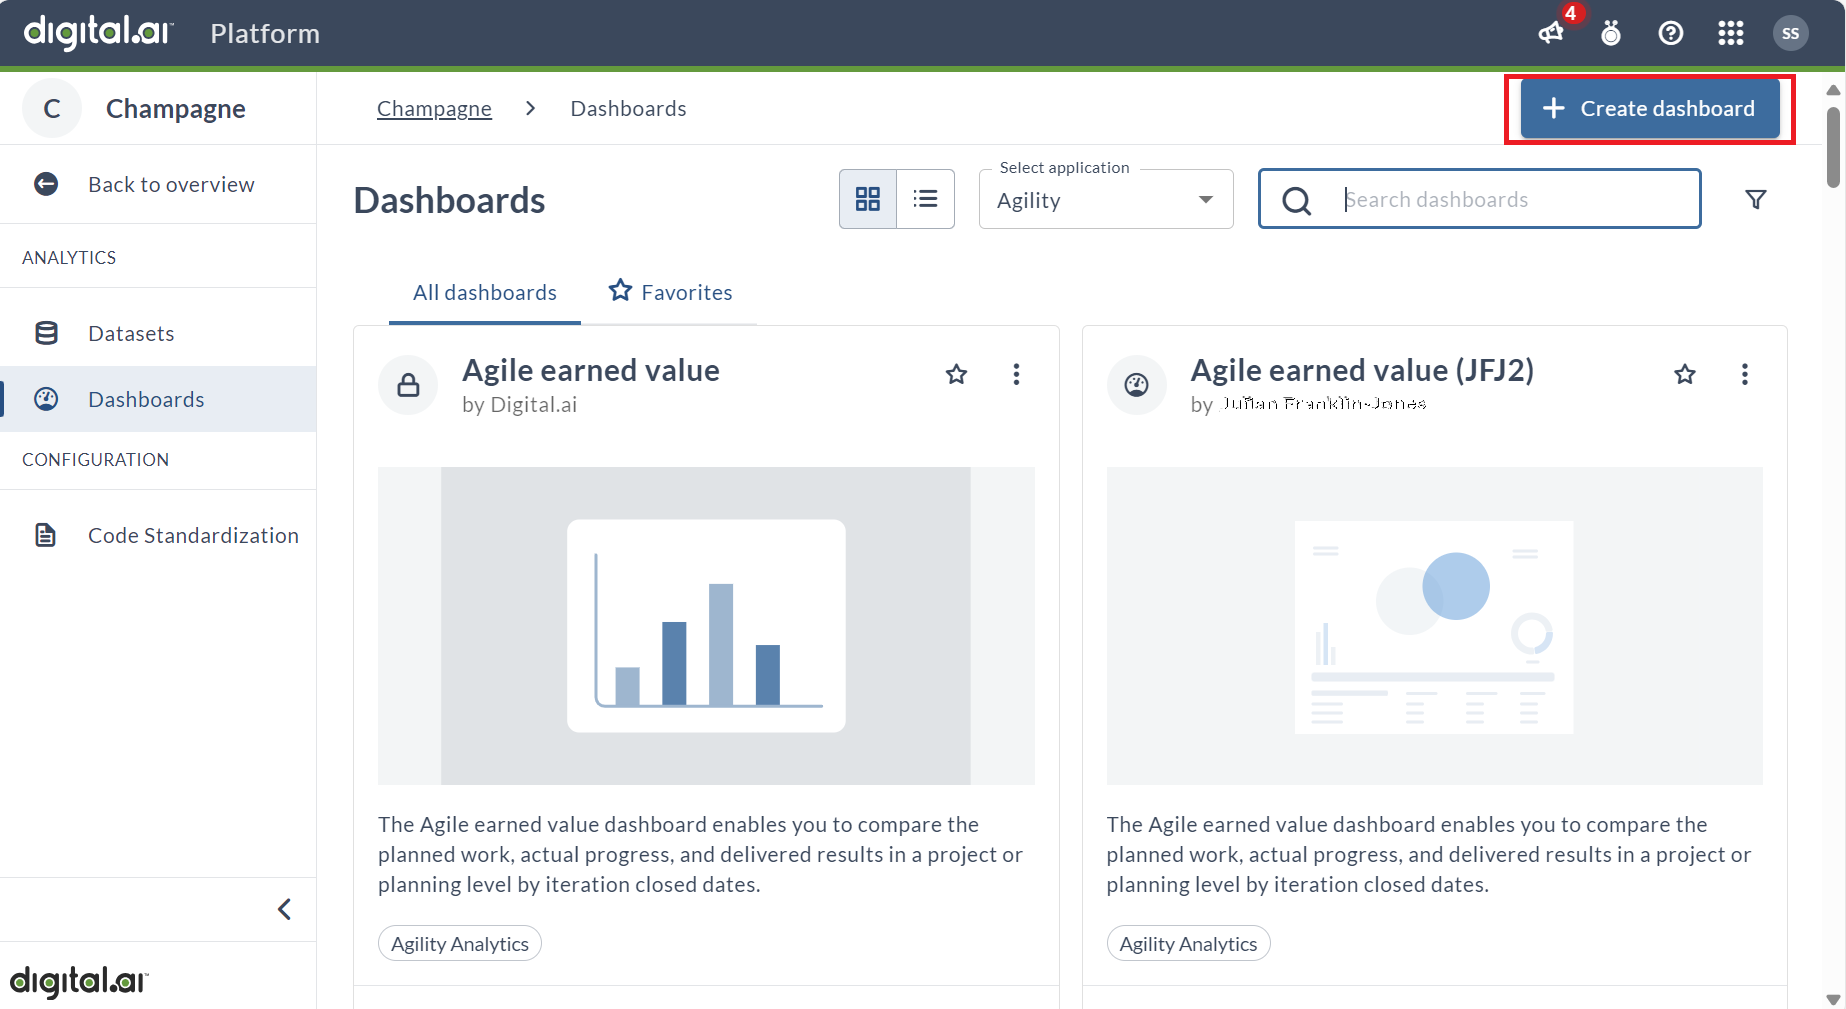
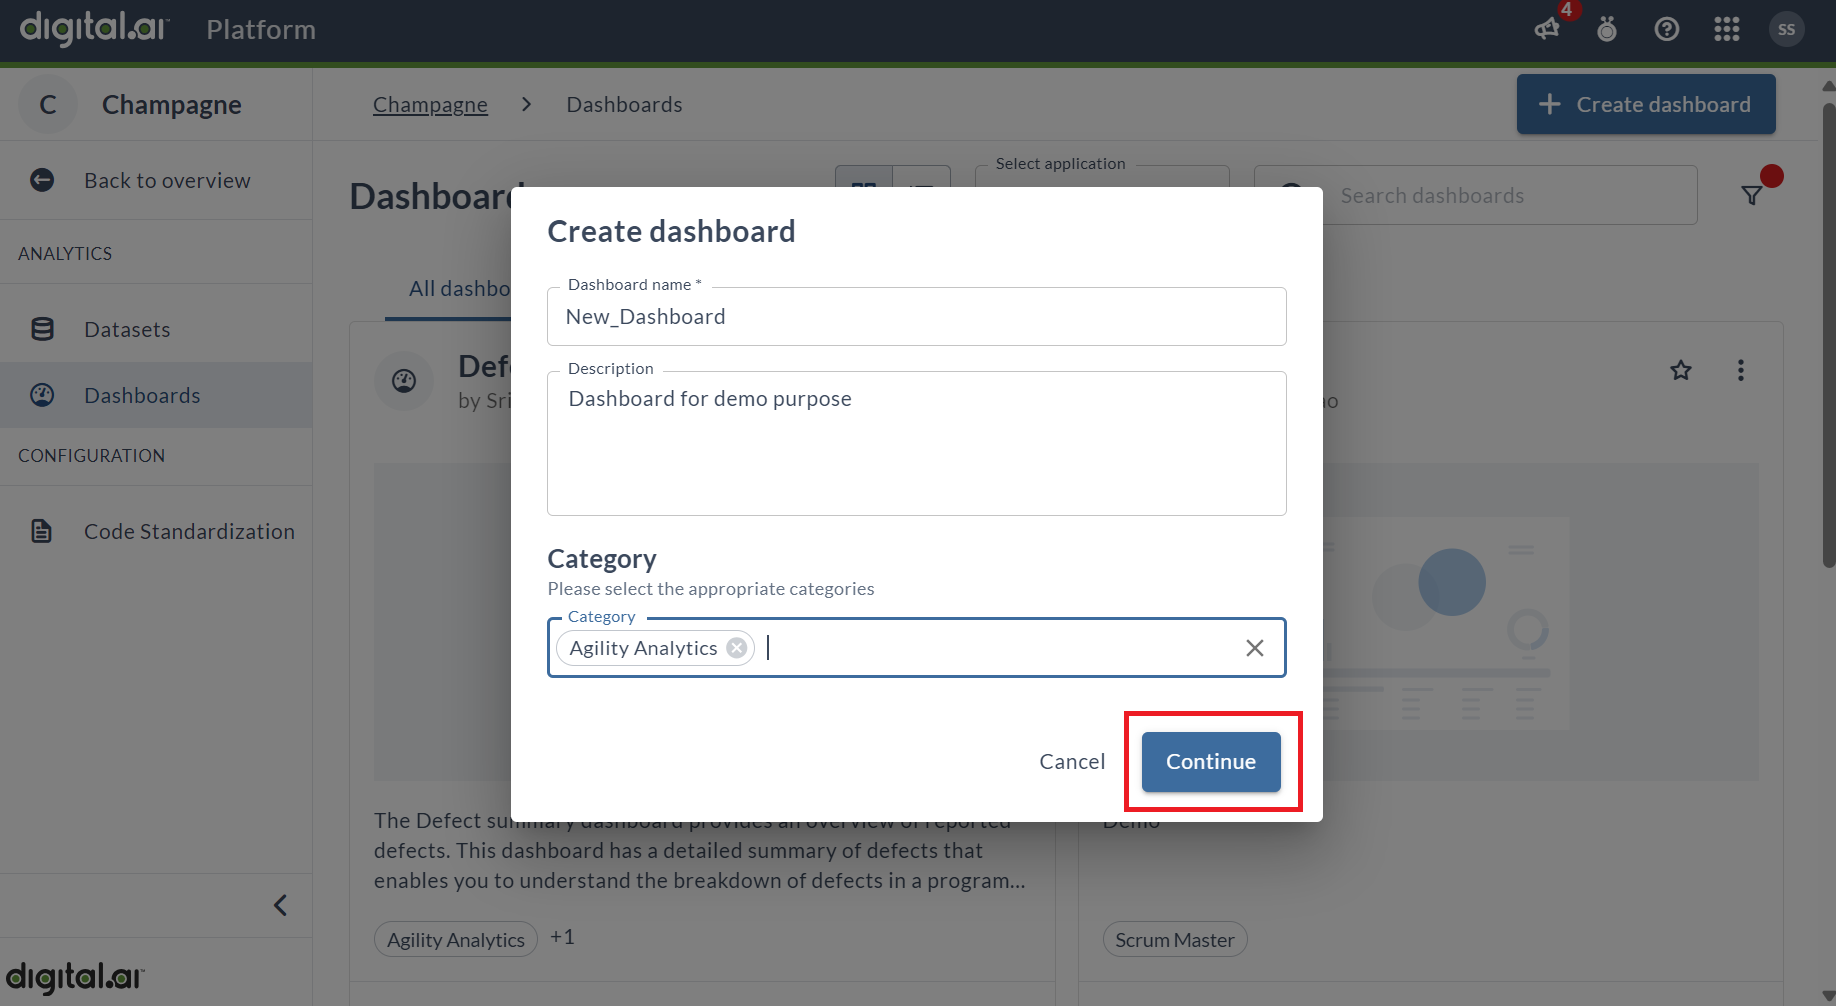
Click Create Dashboard to create a new customized dashboard.
In the dashboard creation process, it is mandatory to provide a Dashboard name, as it serves as a unique identifier for the dashboard. However, filling in the Description and Category fields is optional, allowing users the flexibility to provide additional context and categorization if desired. Once the required Dashboard name field is populated, Click Continue.
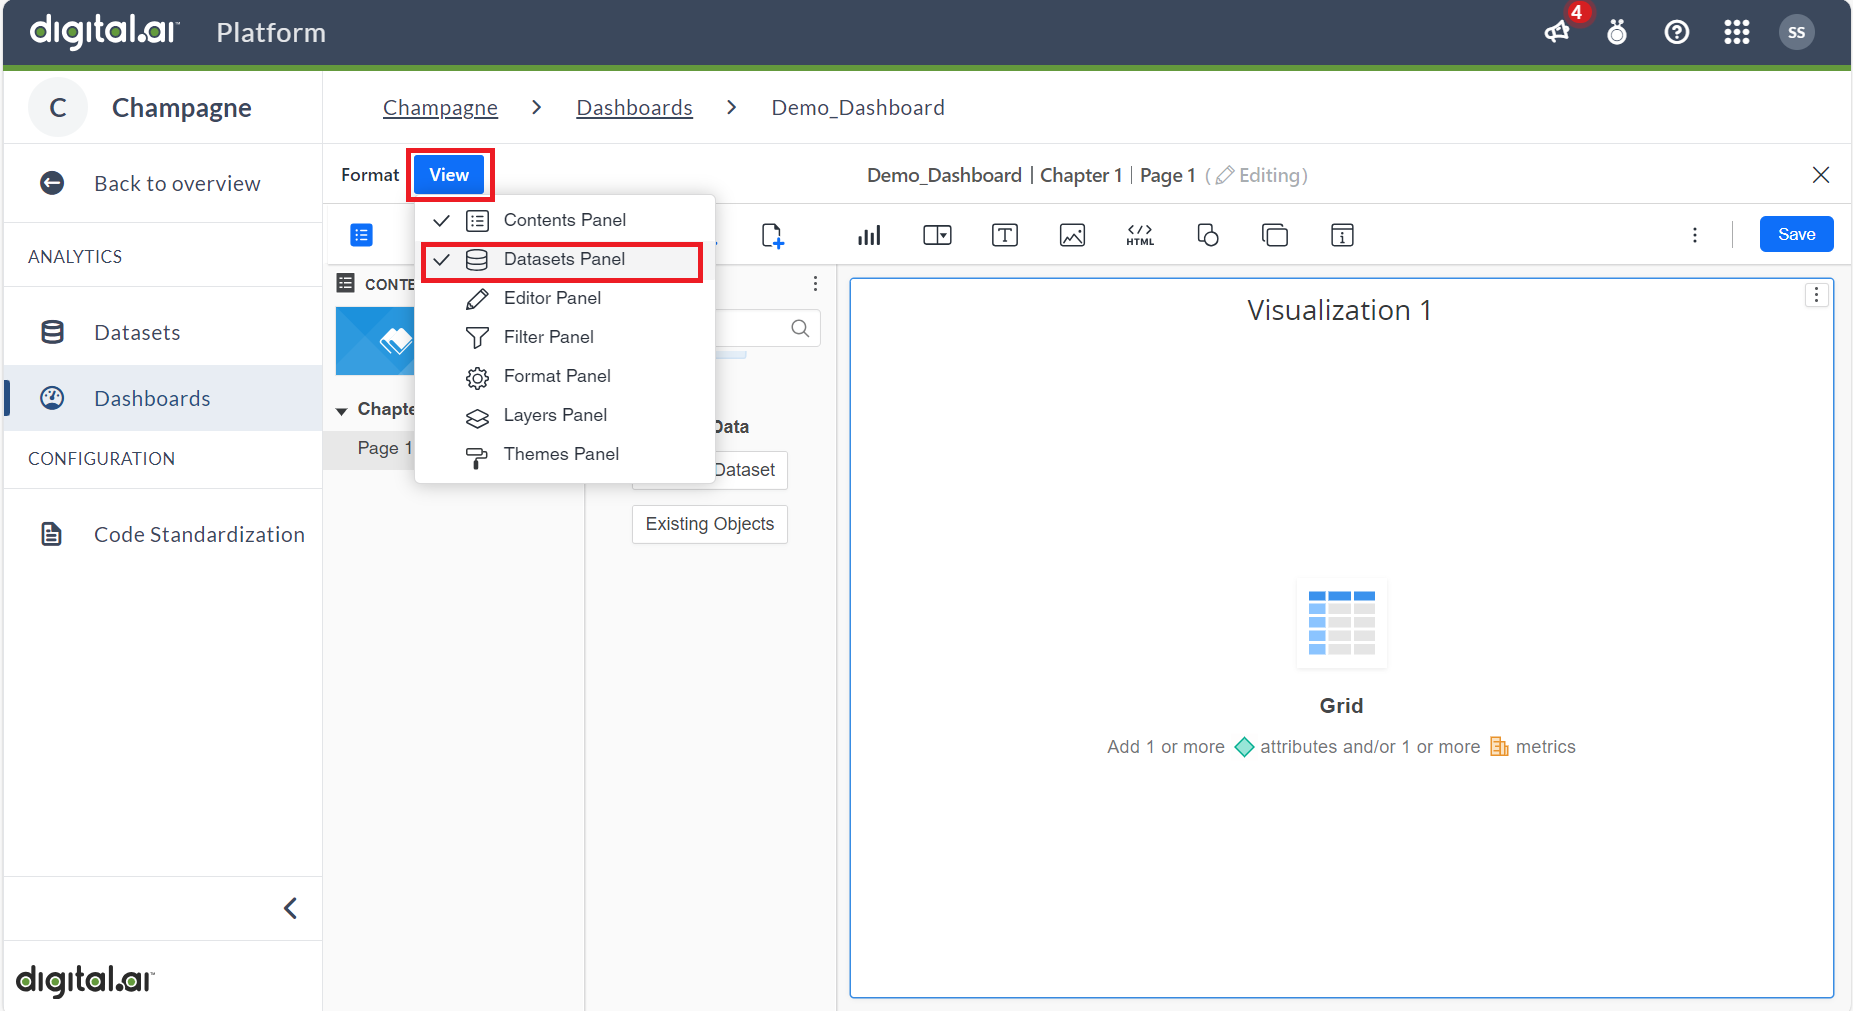
For each dashboard to function effectively, it requires a reliable source of data. In the context of Digital.ai Analytics, datasets serve as the foundational structures for organizing and presenting this data. Digital.ai has a diverse array of datasets to support various use cases, ensuring that users have access to relevant and structured information. Additionally, depending on your licensing agreement with us, you may be granted the ability to create and customize your own datasets, tailored to meet your specific needs. Click View and then select the Datasets Panel to create a dashboard using datasets.
For more information about datasets, see Managing Datasets.
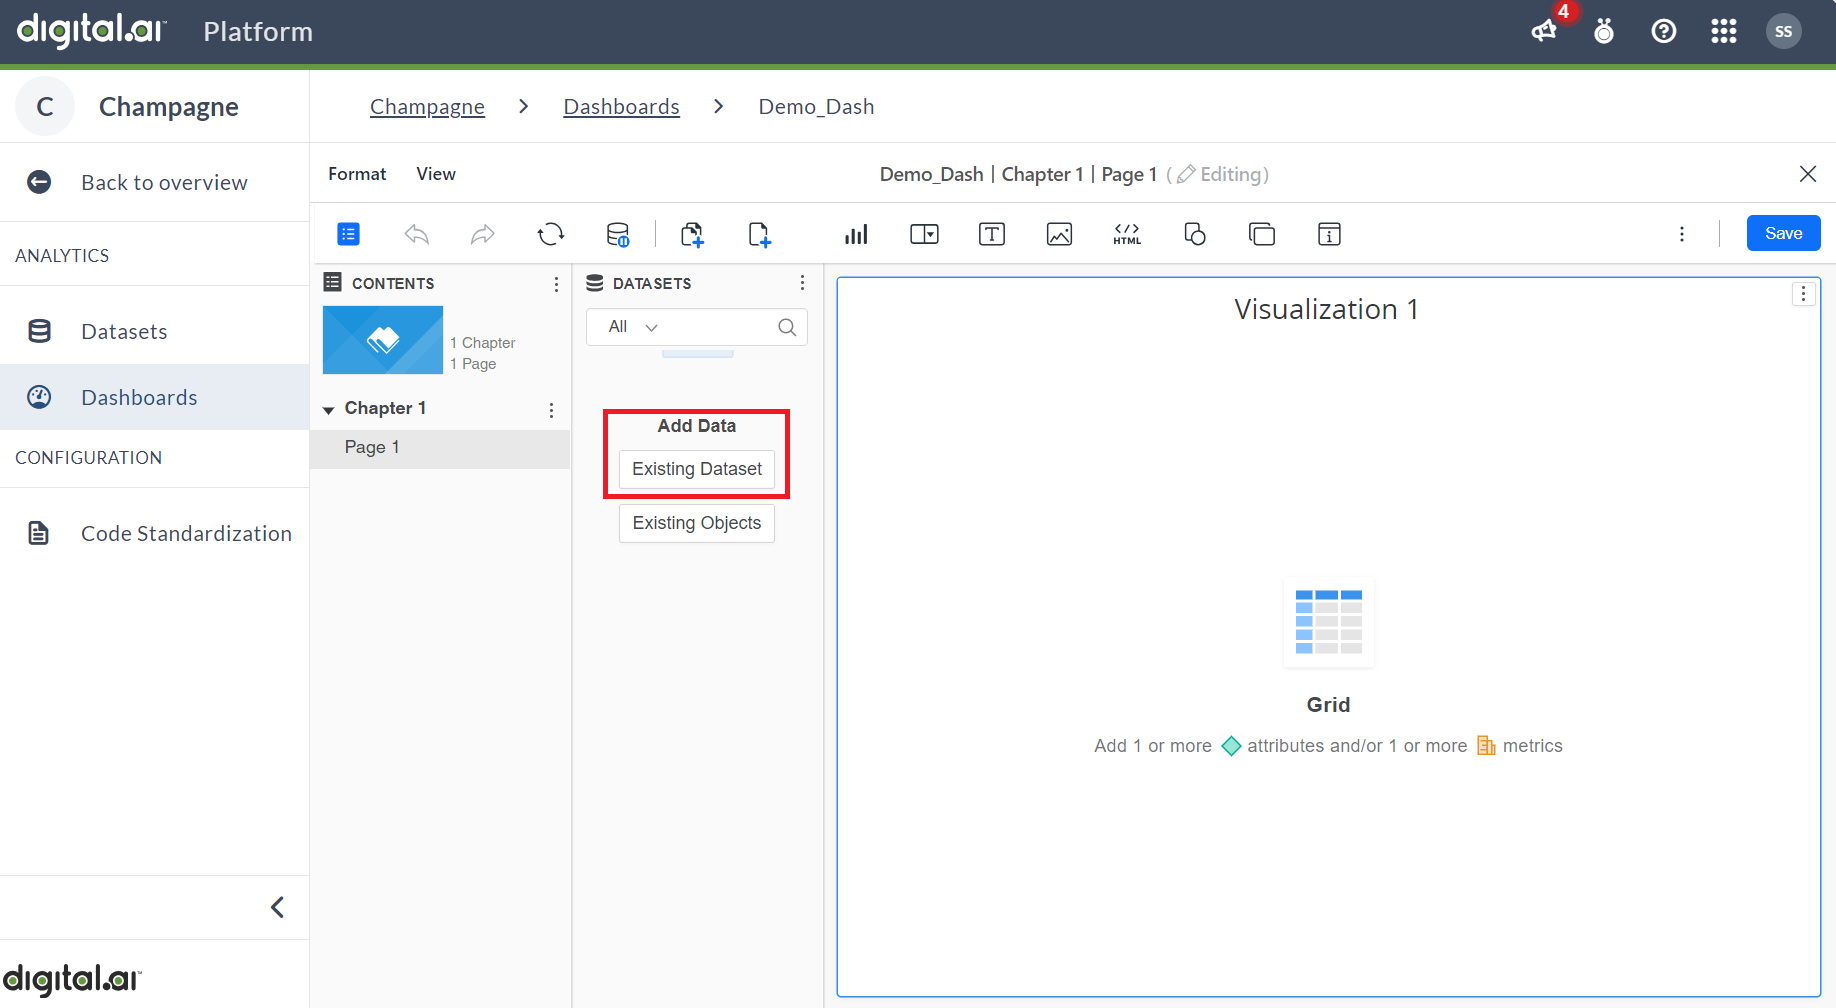
Click Existing Dataset to create a dashboard.
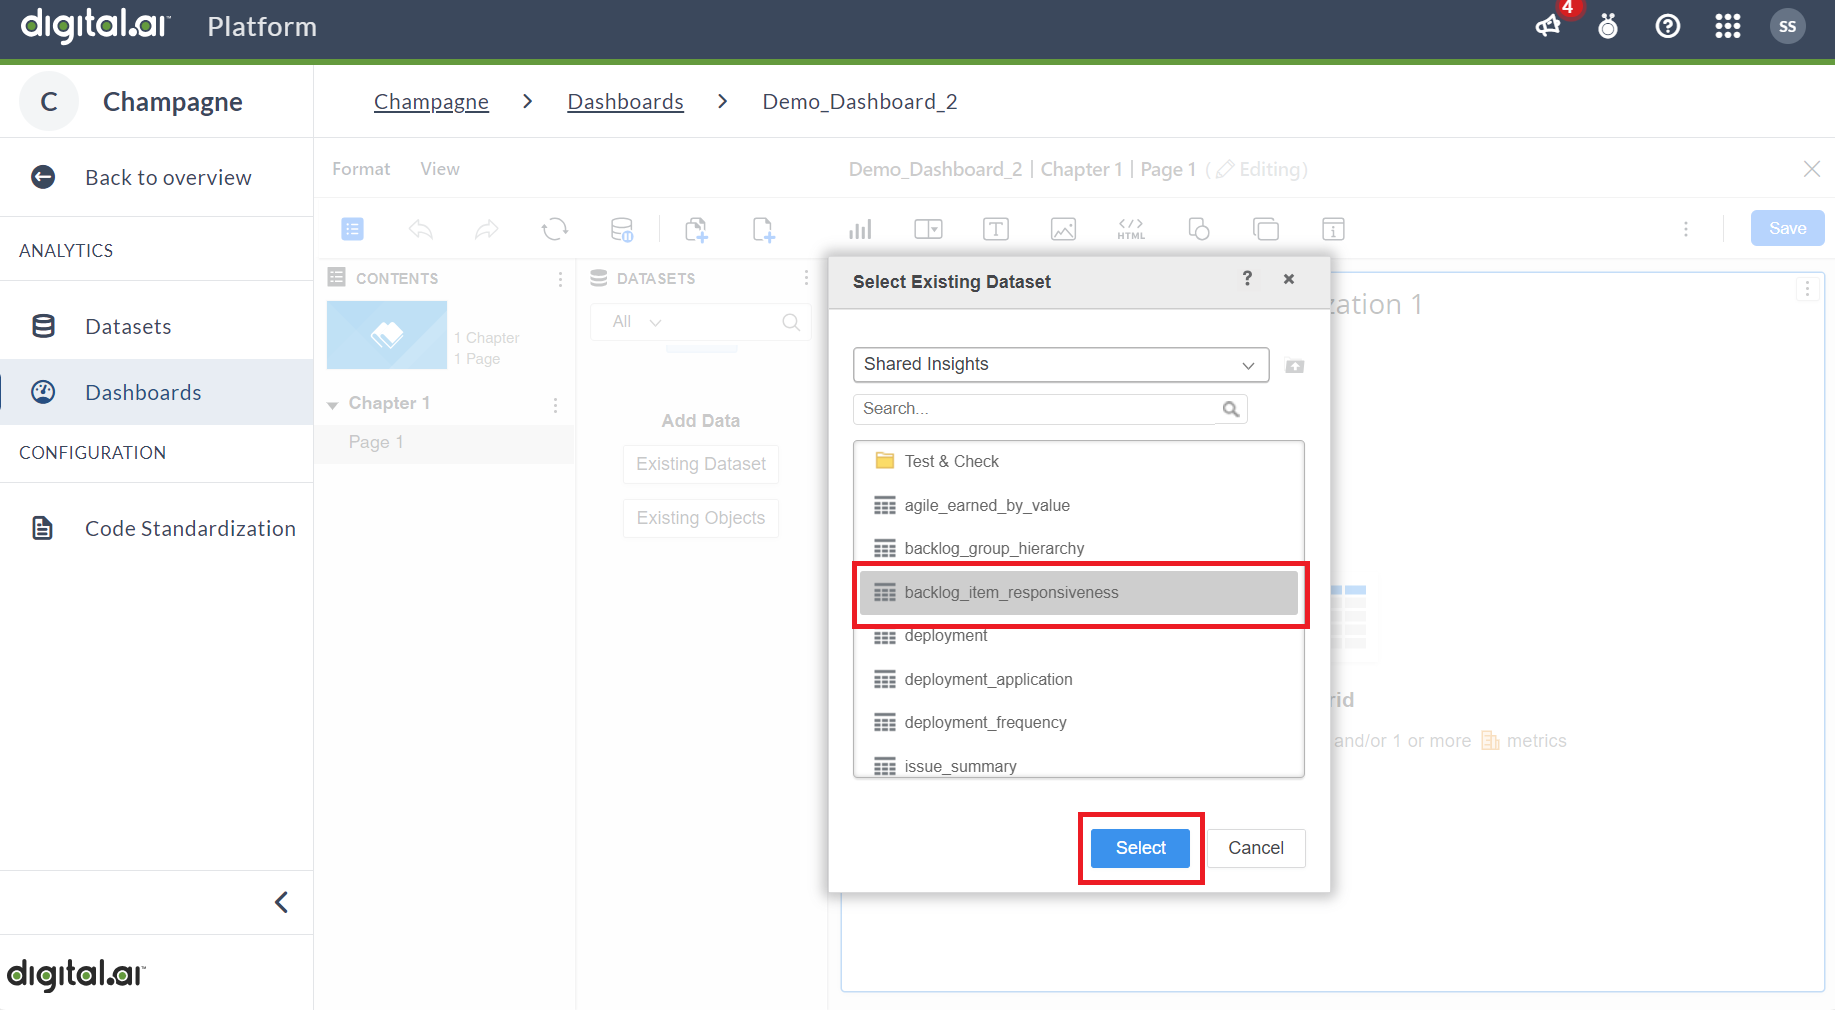
To proceed further, click on the required dataset from the list of available datasets and then click Select option.
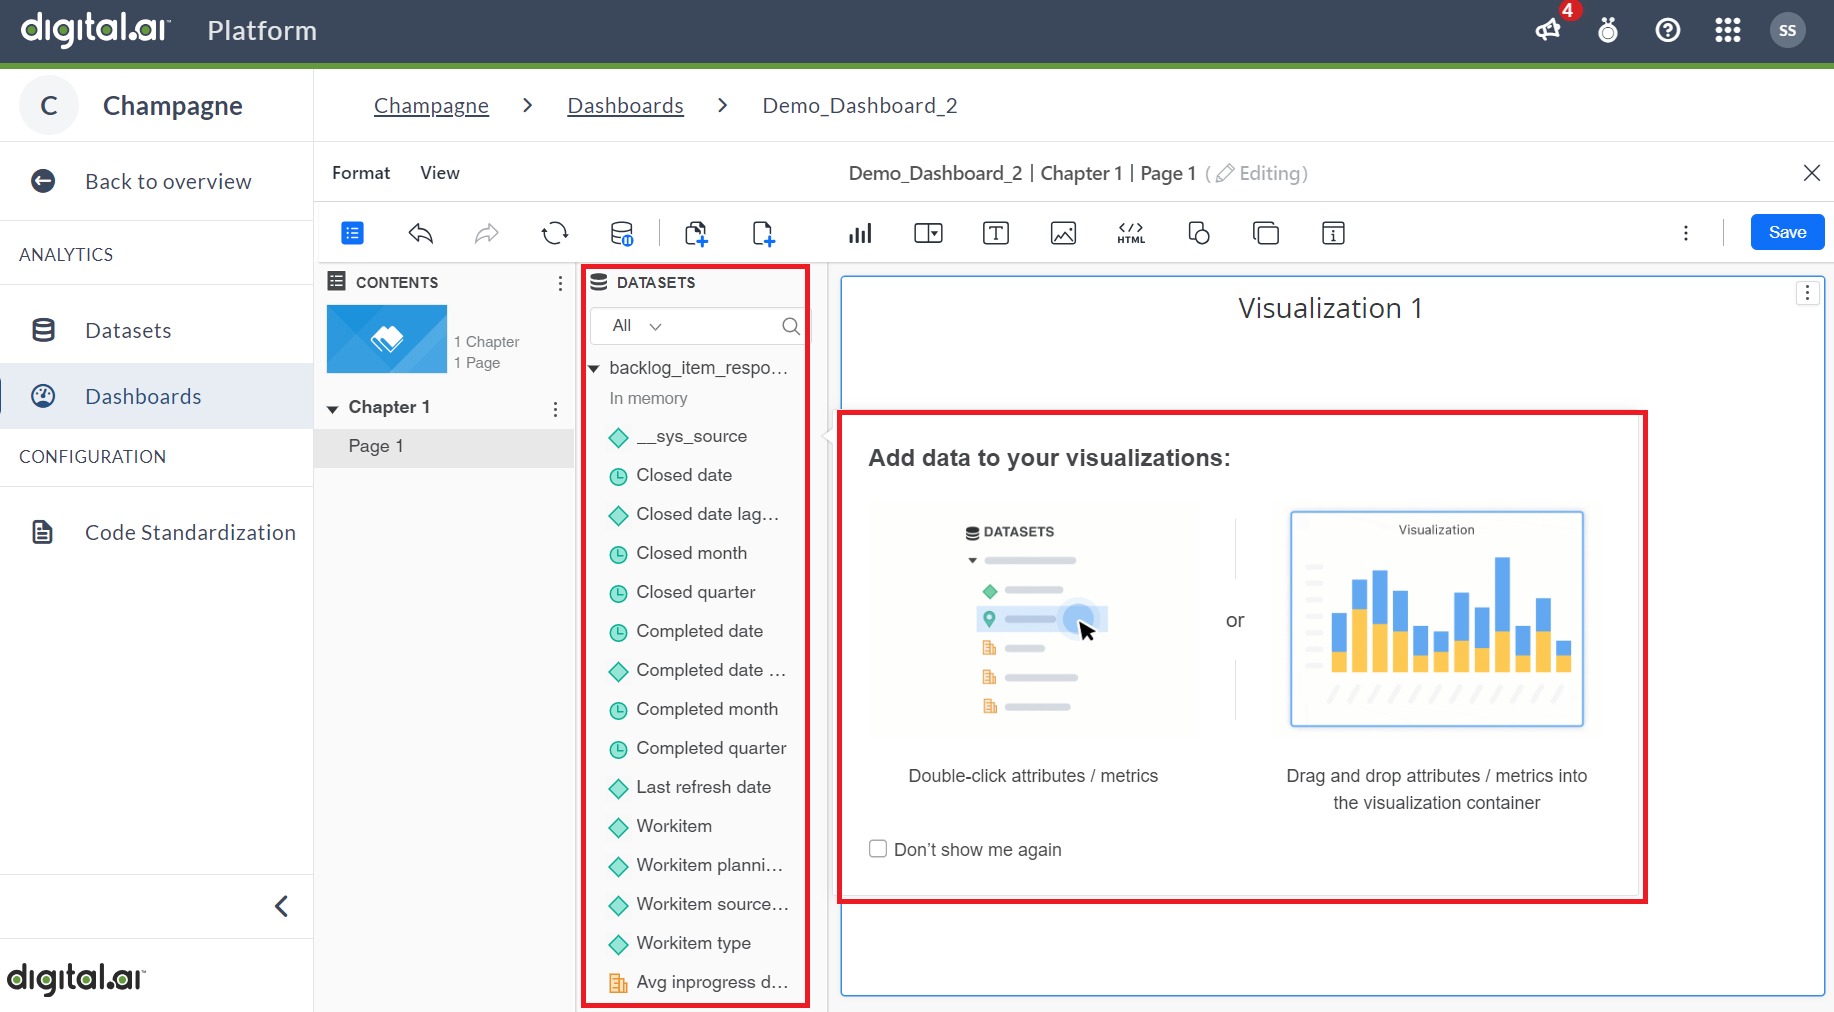
Double-click on the required attributes to select them.
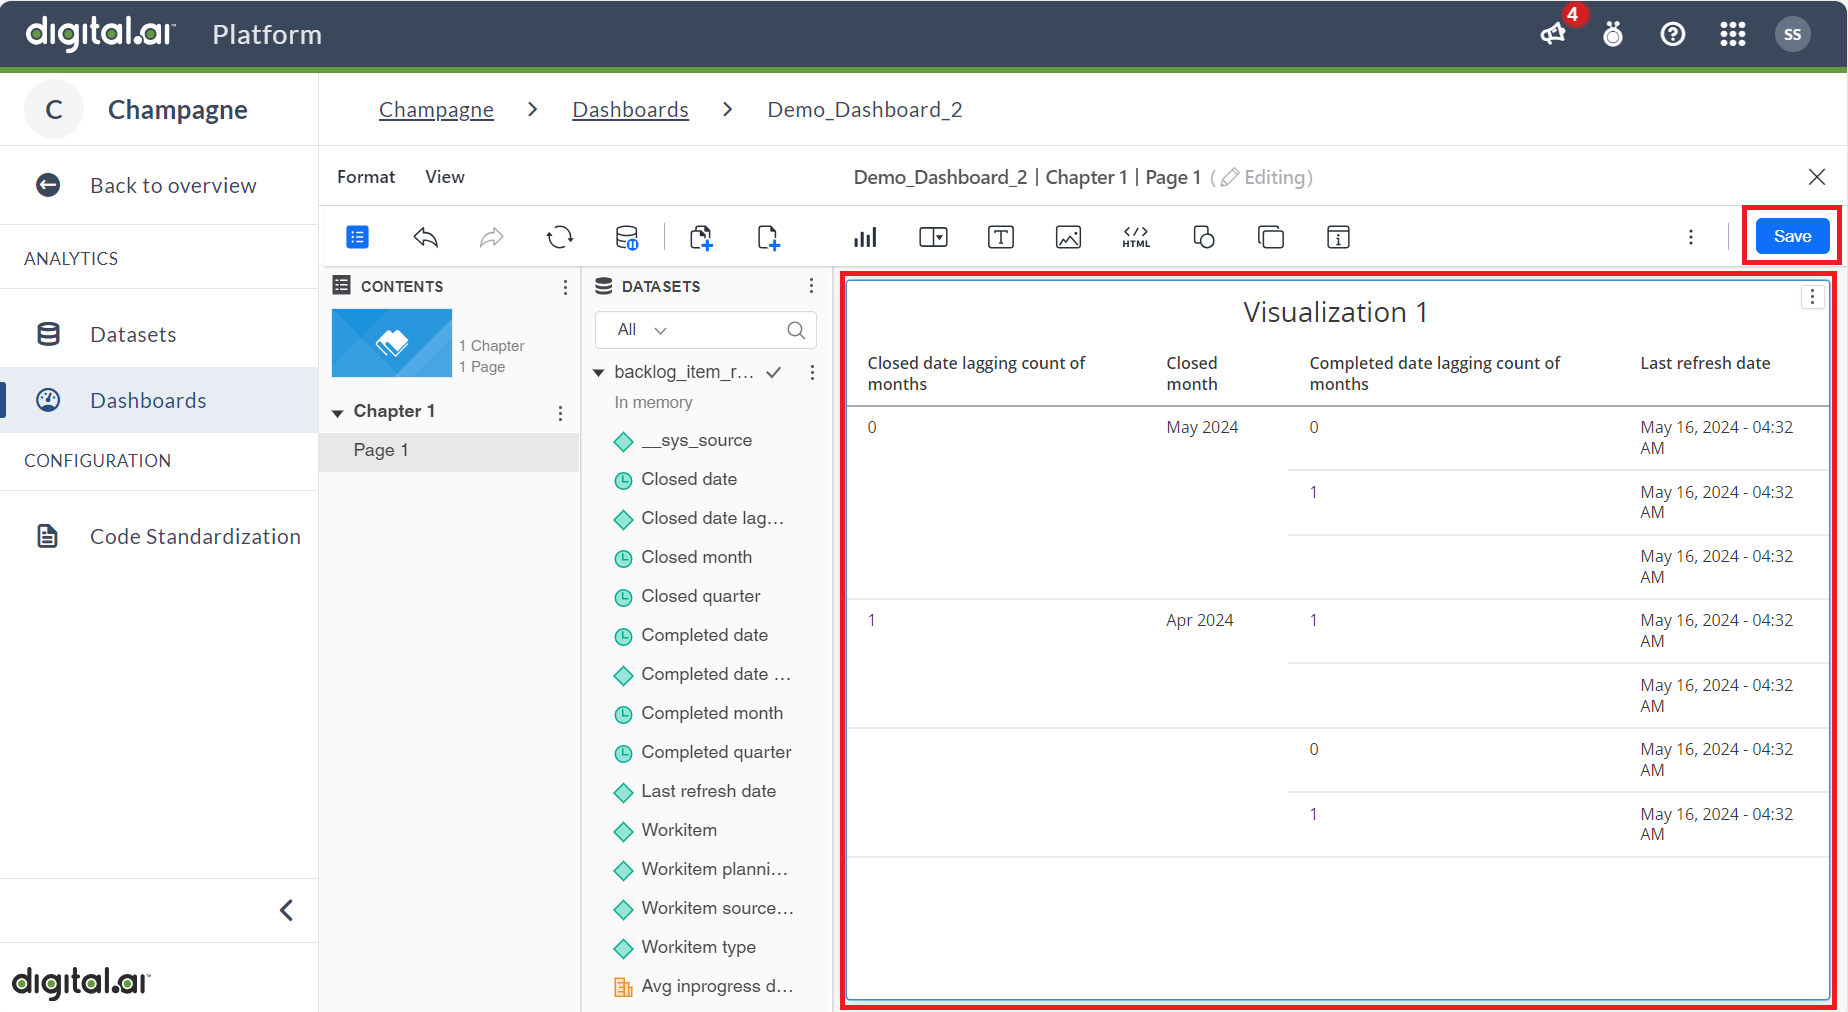
You can see the selected attributes appear on the Visualization screen. After confirming your choices click Save to create the dashboard.
The created dashboard appears in the list of dashboards in the Draft state. Work-in-progress dashboards are saved as Draft, accessible only to users with the role of Author or above. Once the author determines that the Draft version is ready for end-user consumption, they must click Publish. Publishing the dashboard makes it available for regular users to view in both the platform and the source application.
