Working with Analytic Grids
In addition to Quicklist features such as customization, filtering, sorting, and exporting; Analytic Grids give you the ability to group data and aggregate values and provides support for charts and cross tabulation tables. Finally, grid configuration can be saved and shared across the organization.
Analytic Grids are available for Portfolio Items, Backlog Items, Defects, TestSets, Tasks, Test, and Effort.
Accessing the Analytic Grids
- Click the hamburger menu
 > Analytics.
 - Click the Analytic Grids tab and select a tab underneath.
What You Can Do
- Step 1. Select a Project and Program
- Step 2. Customize the Data Presentation and Layout
- Manage the Page View
- Save a Grid as a PDF File
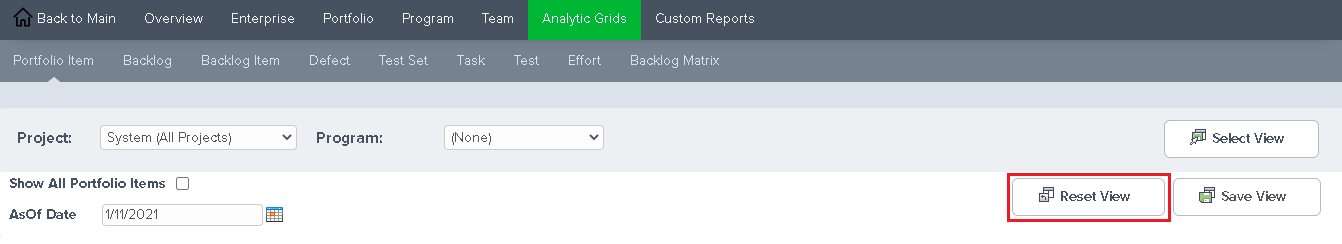
Step 1. Select a Project and Program
- Select a Project.
- If visible, select a Program.
- Select a date in the AsOf Date field. Today's date is populated by default.

Step 2. Customize the Data Presentation and Layout
The following sections describe the controls used to customize how data is presented.
| Formula | Allows you to add a custom column to the grid that is based on a formula. The Column Name is specified in the Name field and the Formula is specified in the Formula field. Use the "Insert a column" dropdown along with the "Insert" button to add columns to the formula. The "Data Type" and "Display Format" are used to control how the data is presented. Additional information on supported formula is available on the Formula Help page. |
|---|---|
| Filter | Allows you to filter the data visible in the grid. |
| Add Chart | Allows you to add charts to the grid page. Once you select a chart type, you are prompted for the data elements to include. Charts are added below the table by default, but can be moved to the top. |
| Add Crosstab | Allows you to add a cross tabulation, or pivot, table to the page. Crosstab tables are always positioned below the grids. |
| Table | The Layout configuration panel allows you to show and hide columns on grid. The column order is changed by dragging the column headers. You do not open the Layout Panel to change column order. Columns Sort Allows you change how the data is sorted in the grid. Group Allows you to control how the grid data is grouped. Aggregate Allows you aggregate the grouped data. The Aggregate functions available are: Sum, Average, Standard Deviation, Count, Distinct Count, Minimum, Maximum. Paging Allows you to enable or disable paging and determine the number of rows on a page. Paging is enabled by default and the default rows per page is 20. |
Saving and Managing Grid Views
After you have configured a grid, you can save it for future use.
Saving a Page View
- Click the Save View button.
- Enter a view title in the Name field and click Save.
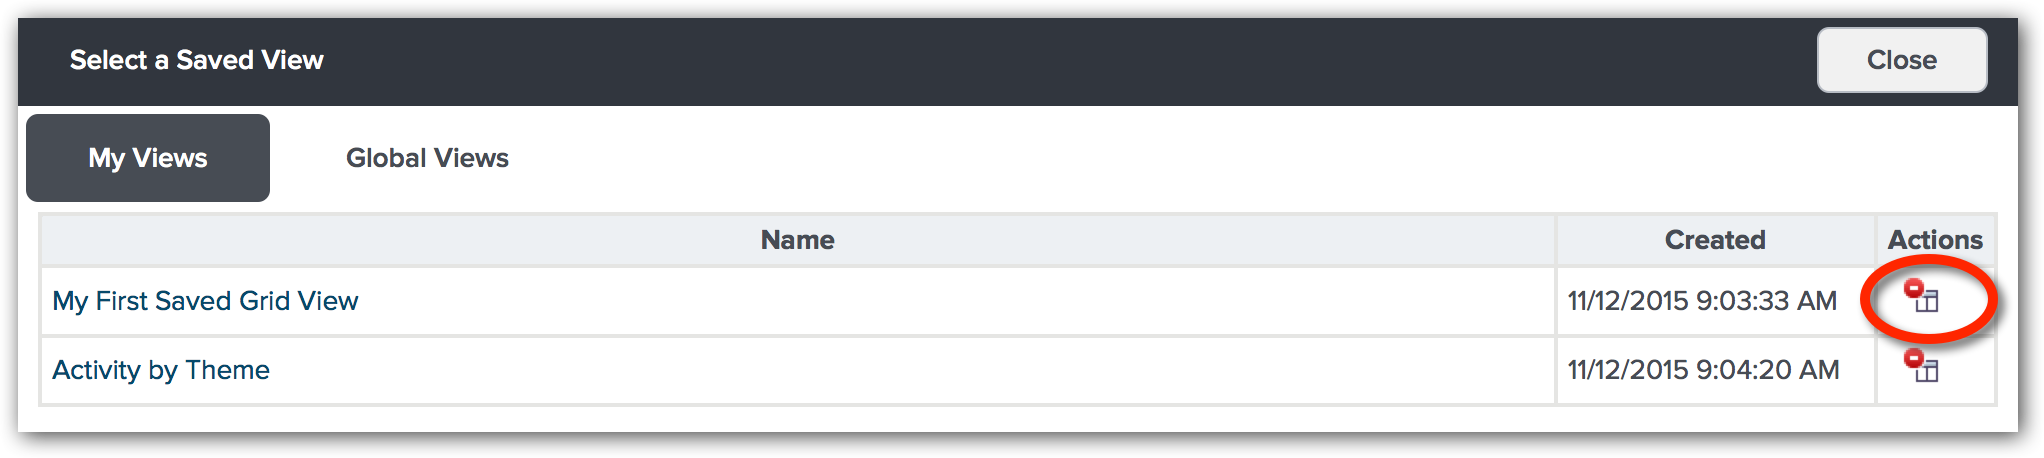
Accessing a Saved View
On the My Views tab, you can also delete views that you created.
- Click the Select View button. The Select a Saved View dialog box opens.
- Click on the My Views or the Global Views tab, and click on a view name.
- The My Views tab shows the list of views you saved
- The Global Views tab shows the views saved by others in your organization.
Deleting a Saved View
- Click the Select View button. The Select a Saved View dialog box opens.
- Click the delete action button for the view you want to remove.
Resetting a Page View
Click the Reset View button to change a grid to the default view.
Saving a Grid as a PDF File
If you'd like to save a grid as a PDF file, simply click the PDF button at the top of any grid or report.