Work Item Time in Status Histogram Dashboard

The Work Item Time In Status Histogram dashboard is a histogram that represents the distribution of the duration that work items remain in the specified status value. This dashboard displays the various durations of work items for a selected status. You can do data analysis and research using this histogram.
The Last refresh date on this dashboard refers to the date and time when the data displayed on the dashboard was last updated or refreshed from the underlying data sources. You can know the data's freshness and make informed decisions based on the most recent information.
This dashboard is built using the work_item_in_status dataset.
Here is an example work item time in status histogram panel.
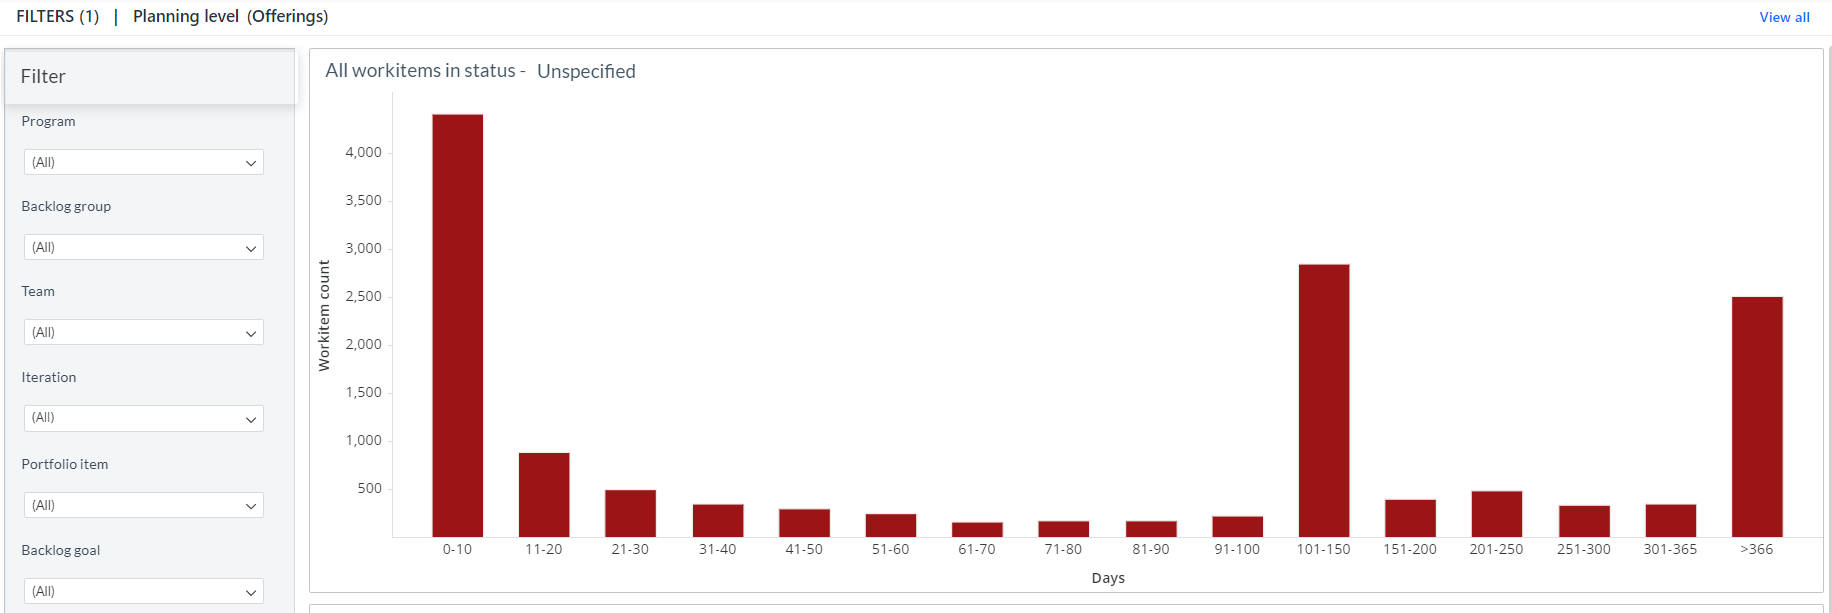
You can filter and view the required data using the following filters:
- Planning level: Displays data of work items in the selected planning level and all child planning levels that belong to the planning level.
- The following filters display filter values based on the filtered planning level.
- The following filters cascade each other except the Last date time in status filter.
-
Program: Displays data of work items in the selected program.
-
Backlog group: Displays data of work items in the selected backlog group and child backlog group that belongs to the backlog group.
-
Team: Displays data of a specific group of cross-functional members.
-
Iteration: Displays data of a specific planning period for an Agile team.
-
Portfolio item: Displays data of work items in the selected portfolio item and child work items that belong to the portfolio item.
-
Backlog goal: Displays data of work items in the selected backlog goal.
-
Work item type: Displays data of work items in any of the following work item types: Defect, Story, and Test set.
-
Work item status: Displays data of work items in the selected status.
-
Work item State: Displays data of work items in any of the following reporting category states: in progress and closed.
-
Last date time in status: Displays data of work items in the selected date range.
You can use these filters to refine the displayed data. For example, you can choose an iteration from the Iteration filter to view the corresponding histogram. Here is an example iteration-filtered panel.
All Work Items
Displays the distribution of work items in the selected status. The histogram is grouped by the number of days of work items in the selected status value. The bar's length represents the duration of work items in the status value. The x-axis represents the days, and the y-axis represents the work item count. You can hover the cursor over the panel to see the days and the work item count.
All Backlog Items in Status
Displays detailed information about work items. The provided information includes various details such as ID, work item link, title, state, created on, first date in status, last date in status, and days in status. This grid lists the details of all work items categorized under All Work Items.
You can also click the ![]() icon against the work item ID to launch the source system and view more work item details such as status, description, owner and team.
icon against the work item ID to launch the source system and view more work item details such as status, description, owner and team.
Components of dataset
The following components of the dataset are used in this dashboard:
Attributes
| Attribute Name | Description |
|---|---|
| Created On | Date on which the work item was created |
| Days | Days a work item spent in a specific status |
| First Date in Status | First date on which the status is changed |
| Last Date in Status | Last date on which the status is changed |
| State | Current state of the work item |
| Title | Title of the work item |
| ID | ID refers to a work item that represents work to be completed |
Metrics
| Metric Name | Description |
|---|---|
| Work item count | Count of work items in a program or planning level |
| Days in Status | First date of the work item in the selected status value |