Work Item Summary Dashboard

The Work Item Summary dashboard provides a detailed overview of all work items, including backlog items, defects, and test sets in a planning level or program. It breaks down the information based on different aspects like status, priority, and type, helping you gain insights into the composition and distribution of work items across various dimensions.
The Last refresh date on this dashboard refers to the date and time when the data displayed on the dashboard was last updated or refreshed from the underlying data sources. You can know the data's freshness and make informed decisions based on the most recent information.
This dashboard is built using the work_item_summary dataset.
Work Item Summary
Displays summary of work items. Using the Group By filter, you can view the summary of the work items on different dimensions like status, priority, and work item type. The status values are unspecified, done, and completed. The priority values are unspecified, high, medium, and low. The work item type values are story, defect, and test set. You can hover the cursor over the panel to see the dimension, work item count, and percentage of dimension.
Here is an example work item summary panel.
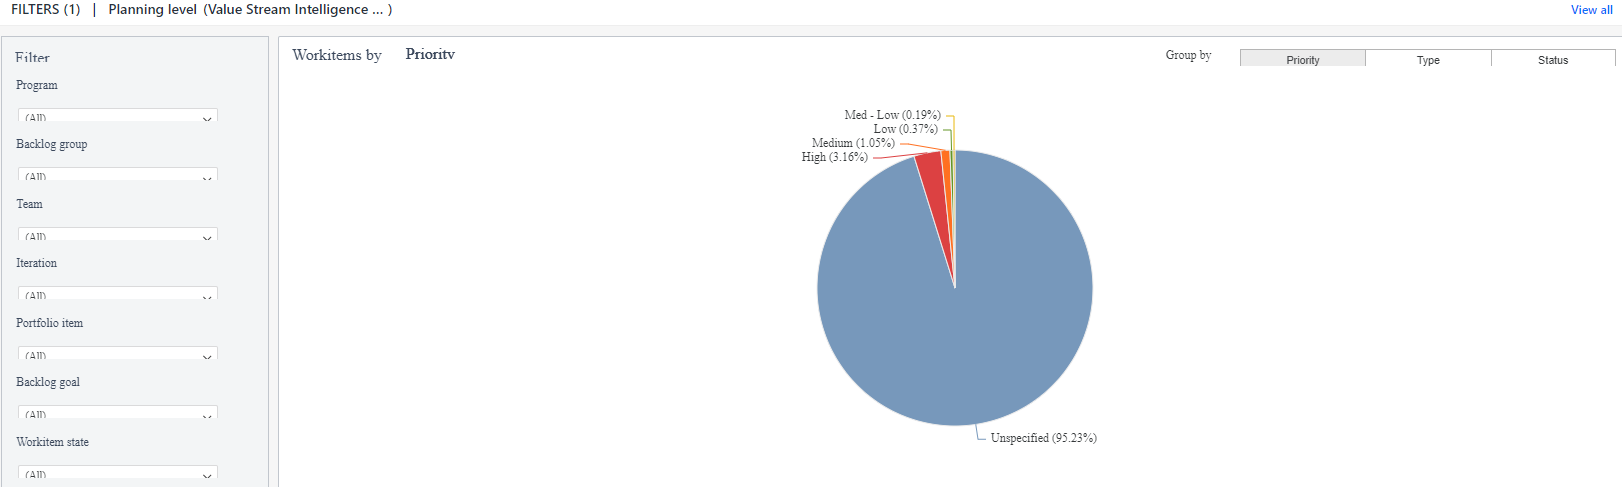
You can filter and view the required data using the following filters:
- Planning level: Displays data of work items in the selected planning level and all child planning levels that belong to the planning level.
- The following filters display filter values based on the filtered planning level.
- The following filters cascade each other.
- Program: Displays data of work items in the selected program.
- Backlog group: Displays data of work items in the selected backlog group and child backlog group that belongs to the backlog group.
- Team: Displays data of a specific group of cross-functional members.
- Iteration: Displays data of a specific planning period for an Agile team.
- Portfolio item: Displays data of work items in the selected portfolio item and all child portfolio items that belong to the portfolio item.
- Backlog goal: Displays data of work items in the selected backlog goal.
- Work item state: Displays data of work items in any of the following reporting category states: in progress and closed.
- Group by: Displays data of work items in any of the following dimensions: status, priority, and work item type.
You can use these filters to refine the displayed data. For example, you can choose a program from the Program filter to view the corresponding work item summary dashboard. Here is an example program-filtered panel.

Components of dataset
The following components of the dataset are used in this dashboard:
Attributes
| Attribute Name | Description |
|---|---|
| Priority | Priority of the work item |
| Status | Current status of the work item |
| Type | Type of work item |
Metrics
| Metric Name | Description | |-------------|------------|-------------| |Work item count|Count of work items in an iteration|