Work Item Cycle Time Summary Dashboard

The Work Item Cycle Time Summary dashboard provides an overview of the average time that work items, such as stories, defects, and test sets, are in various status values throughout their lifecycle. The dashboard calculates and displays the average cycle time for work items. Cycle time represents the duration for a work item to transition through various status values from its initiation to completion.
Cycle refers to the duration of a work item to move from the filtered two status like developing to the ready to demo status.
The Last refresh date on this dashboard refers to the date and time when the data displayed on the dashboard was last updated or refreshed from the underlying data sources. You can know the data's freshness and make informed decisions based on the most recent information.
This dashboard is built using the work_item_in_status dataset.
Here is an example Work Item Cycle Time Summary panel.
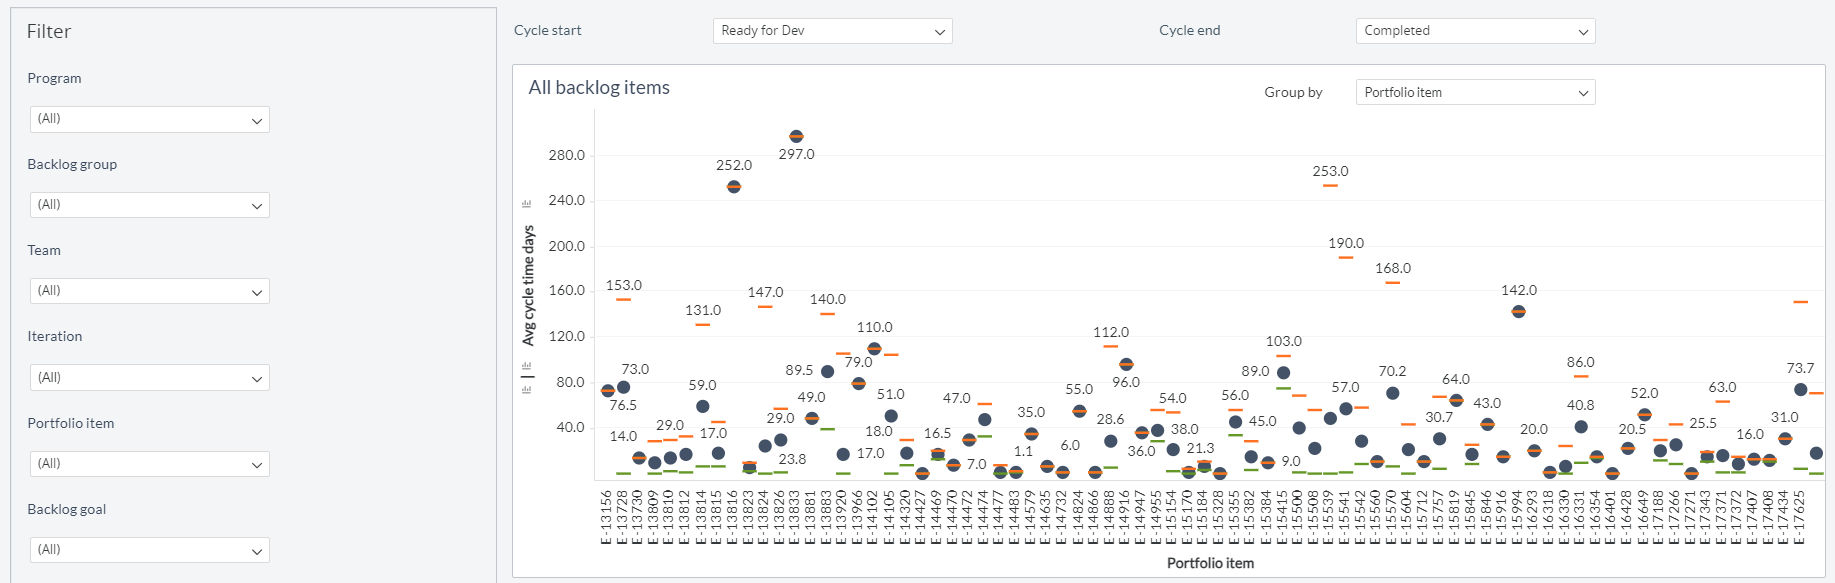
You can filter and view the required data of work items using the following filters:
- Planning level: Displays data of work items in the selected planning level and all child planning levels that belong to the planning level.
- The following filters display filter values based on the filtered planning level.
- The following filters cascade each other except the Include items after filter.
- Program: Displays data of work items in the selected program.
- Backlog group: Displays data of work items in the selected backlog group and child backlog group that belongs to the backlog group.
- Team: Displays data of a specific group of cross-functional members.
- Iteration: Displays data of a specific planning period for an Agile team.
- Portfolio item: Displays data of work items in the selected portfolio item and all child portfolio items that belong to the portfolio item.
- Backlog Goal: Displays data of work items assigned to the selected backlog goal.
- Work item type: Displays data of work items in any of the following types: story, defect, and test set.
- Work item state: Displays data of work items in any of the following reporting category states: in progress and closed.
- Include items after: Displays data of specific date range or period.
- Cycle start: Displays the status of work items that define the beginning of the cycle.
- Cycle end: Displays the status of work items that define the end of the cycle.
If you choose a cycle start range value that is higher than the rank of the cycle end status, the system will automatically swap the selected status values for both options. This ensures consistency and accuracy in defining the cycle range for your analysis.
- Group by: Displays data of work items in any of the following dimensions: work item type, story points, backlog group, team, closed by, created by, and portfolio item.
You can use these filters to refine the displayed data. For example, you can choose a program from the Program filter to view the corresponding dashboard. Here is an example program-filtered panel.
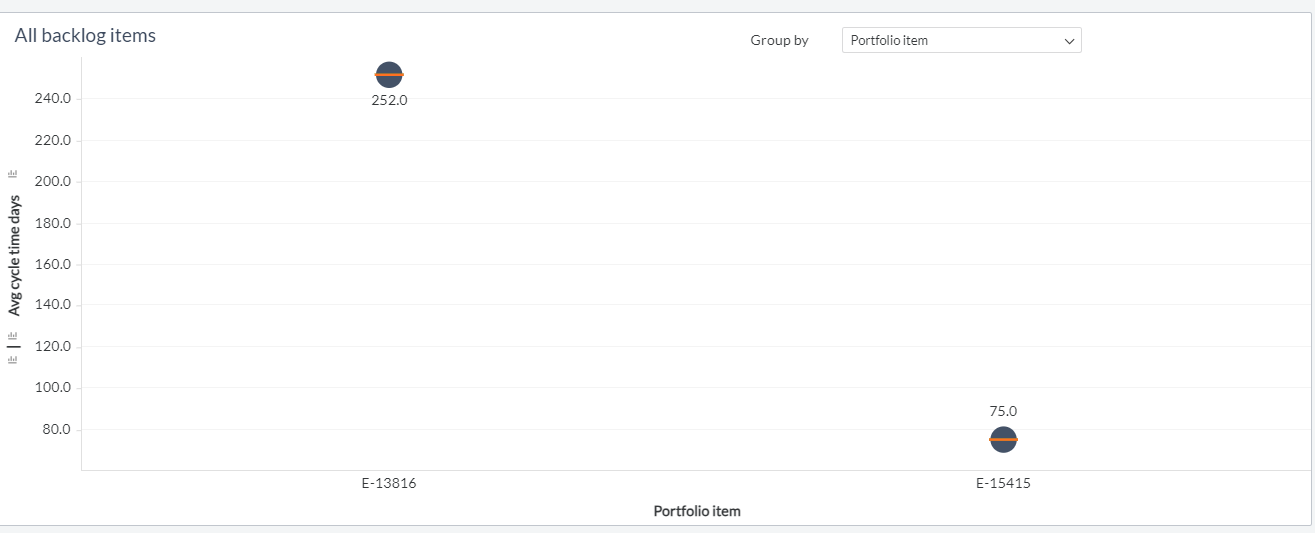
All work item items
Displays the trend in the cycle time of work items. Each bar on the panel represents the average number of days a group of work items is in the defined cycle. Cycle time for an individual work item begins on the day that the work item enters the defined status for cycle start, and cycle time ends for a work item when it enters the defined status value for cycle end. The x-axis represents the groups like work item type, story points, backlog group, team, closed by, created by, and portfolio item and the y-axis represents the average, mode, and median cycle time. You can hover the cursor over the panel to see the maximum, average, and minimum number of cycle days of work items in the selected cycle values, dimensions, and work item count.
All work item items - Days in cycle
Displays detailed information about work items. The provided information includes various details such as dimension, maximum, average, and minimum cycle time days, and backlog item count. This grid lists the details of all backlog items categorized under Work Item Cycle Time Summary.
Components used in this dashboard
The following components of the dataset are used in this dashboard:
Attributes
| Attribute Name | Description |
|---|---|
| Backlog group | Provides logical groups to roll sub-features up into larger groups for tracking purposes. |
| Closed by | Person who closed the work item or portfolio item |
| Created by | Person who created the work item or portfolio item |
| Portfolio item | Unique identifier of portfolio item. It contains a link to the source system. |
| Story points | Story points assigned to the work item |
| Team | Name of the team |
| Type | Type of the work item |
Metrics
| Metric Name | Description |
|---|---|
| Average cycle time | Average duration between work start and work completed for a work item for all the work items in an iteration |
| Maximum cycle time | Maximum duration between work start and work completed for a work item for all the work items in an iteration |
| Minimum cycle time | Minimum duration between work start and work completed for a work item for all the work items in an iteration |
| Work item count | Count of work items in an iteration |