Test Set Analytics Grid
This article explains how to use the Test Set Analytics Grid in Agility.
Overview
The Test Set Analytic Grid presents a grid view of TestSets.
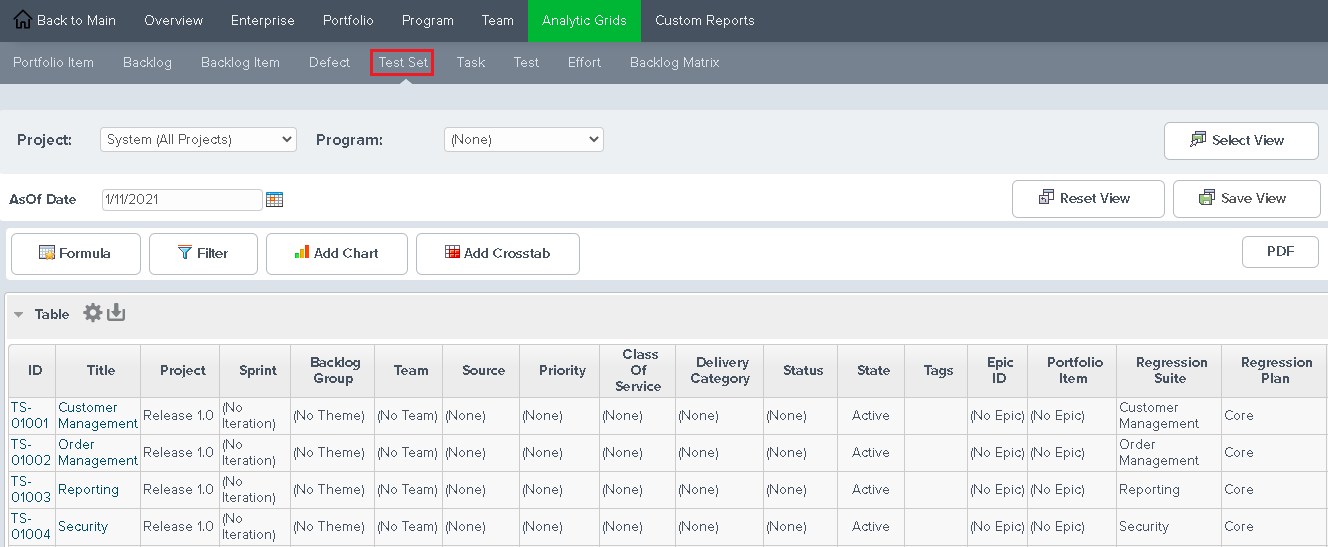
Each bar chart in the grid only includes the data represented by the row and column intersection. Using the controls at the top of the page, you can control: the x- and y- axes of the Bar chart, the aggregate function used to determine the bar height, the row and column grouping and you can filter the data presented.
Accessing this Grid
- Click the hamburger menu
 > Analytics.
 - Click the Analytic Grids tab followed by the Test Set tab.
Please note that Text Fields are not available in Analytic Grids. We do not display text fields on Grids because they are not trended over time and we use an AsOf date on the grids to look across time.
Additional Options
- Printing and exporting a report to PDF
- Saving a report to PDF