Portfolio Item Delivery by Planning Level Dashboard
The Portfolio Item Delivery by Planning Level dashboard provides insights into the distribution and alignment of work across projects or planning levels based on where all child portfolio items are planned, aiding organizations in optimizing their delivery processes and achieving business objectives. The dashboard enables stakeholders to assess the distribution of portfolio item deliveries across various planning levels within the organization.
The Last refresh date on this dashboard refers to the date and time when the data displayed on the dashboard was last updated or refreshed from the underlying data sources. You can know the data's freshness and make informed decisions based on the most recent information.
This dashboard is built using the portfolio_item_summary dataset.
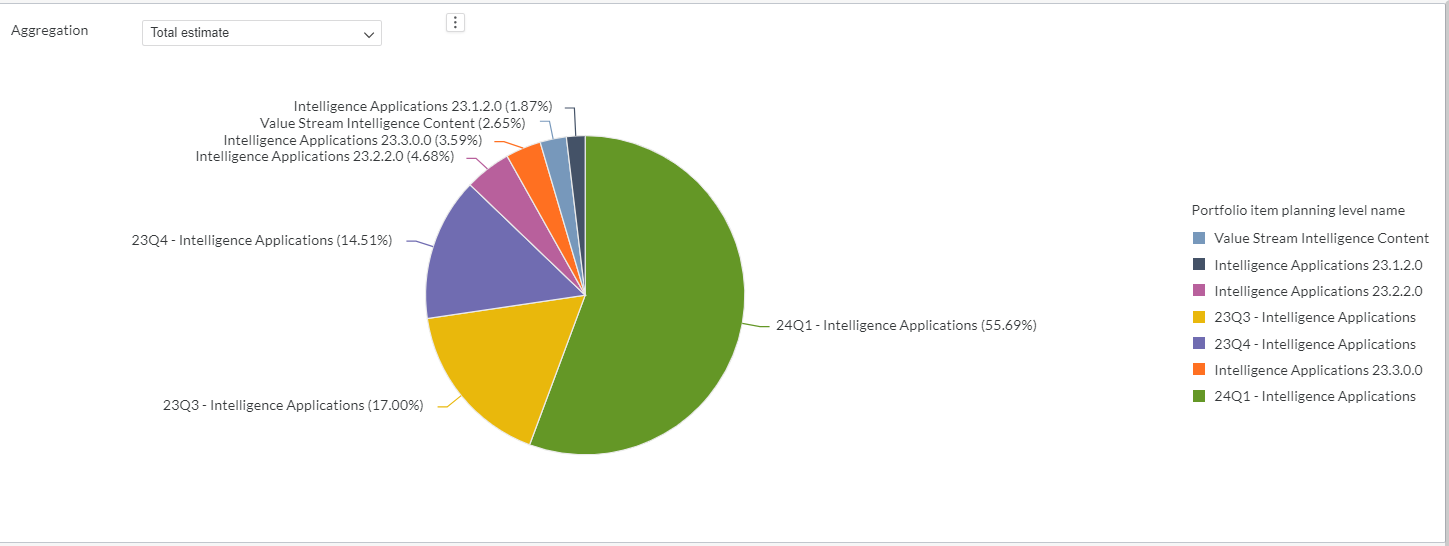
Here is an example portfolio item delivery by planning level panel.

You can filter and view the required data using the following filters:
- Planning level: Displays data of portfolio items in the selected planning level and all child planning levels that belong to the planning level.
- The following filters display filter values based on the filtered planning level.
- The following filters cascade each other except the Aggregation filter.
- Program: Displays data of portfolio items in the selected program.
- Status: Displays data of portfolio items in any of the following statuses: discovery, done, in progress, ready for dev, review, and unspecified.
- Priority: Displays data of portfolio items in any of the following priorities: high, medium, low, and unspecified.
- Type: Displays data of portfolio items in any of the following portfolio item types: epic, feature, initiative, non-functional, sub-feature, and unspecified.
- Strategic theme: Displays data of portfolio items in the selected strategic theme. Strategic themes are vital for guiding organizational strategy, prioritizing initiatives, aligning efforts, fostering collaboration, and driving long-term success in Agility.
- Aggregation: Displays data of portfolio items in any of the following aggregation types: all child portfolio items count, total swag, total value, backlog work item count, and total estimate.
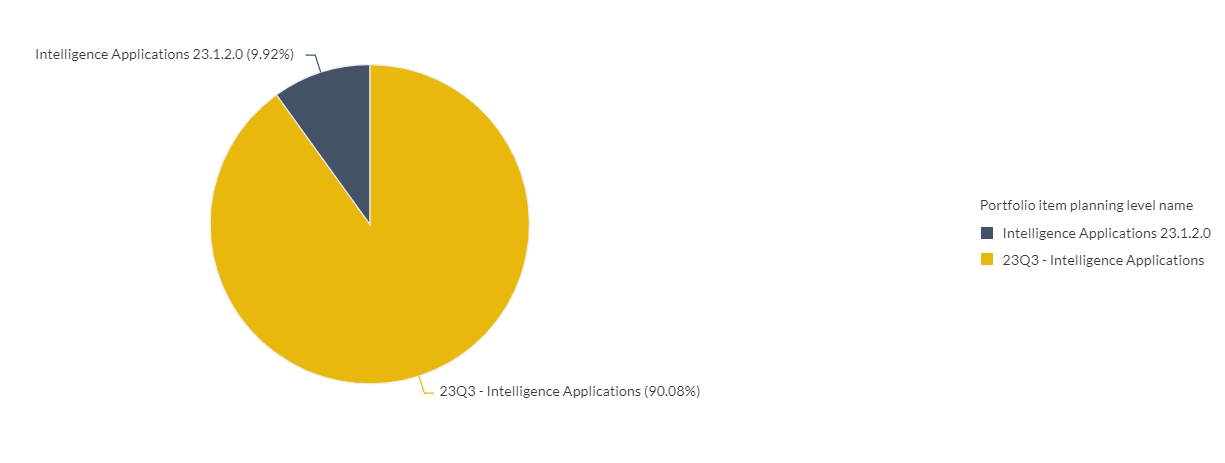
You can use these filters to refine the displayed data. For example, you can choose a program from the Program filter to view the corresponding dashboard. Here is an example program-filtered panel.

Portfolio Item Delivery by Planning Level
Displays a summary of portfolio items organized by planning level. This panel analyzes the immediate child portfolio items within a selected project or planning level, utilizing their project or planning level assignment. It aggregates data based on all child portfolio items count, total swag, total value, backlog work item count, and total estimate. You can hover the cursor over the panel to see the planning level name, percentage contribution, all child portfolio items count, total swag, total value, backlog work item count, and total estimate. This panel has the following aggregation types:
- all child portfolio items count: Count of all child portfolio items within each delivery project or planning level.
- Total estimate: Total estimate of backlog work item in each delivery project or planning level.
- Backlog work item count: Count of backlog items in each delivery project or planning level.
- Total swag: Total amount of Swag in each delivery project or planning level.
- Total value: Total amount of value in each delivery project or planning level.
Chart data
Displays details of immediate child portfolio items including their ID, source URL, name, planning level, backlog work item count, total swag, total value, and total estimate. Each row represents a different child portfolio item within the selected planning level or program.
You can also click the icon against the portfolio item ID to launch the source system and view more work item details such as status, description, owner and team.
Portfolio items
Displays details of top-most portfolio items including their ID, source URL, name, planning level, backlog work item count, total swag, total value, and total estimate. Each row represents a different top-most portfolio item within the selected planning level or program.
You can also click the icon against the portfolio item ID to launch the source system and view more work item details such as status, description, owner and team.
Components used in this dashboard
The following components of the dataset are used in this dashboard:
Attributes
| Attribute Name | Description |
|---|---|
| Portfolio item planning level name | Planning level of the portfolio item |
| ID | Unique identifier of the portfolio item |
| Source URL | URL of the source. It contains a link to the source system. |
| Name | Name of the portfolio item |
| Planning level | Name of the planning level |