Blocked Backlog Item Throughput Dashboard

The Blocked Backlog Item Throughput dashboard provides insights into the number of backlog items marked as blocked within a specified period. This dashboard helps you see and understand issues that are slowing down different types of backlog items. It uses data to help you deal with these problems and make the work process better, leading to improved efficiency and delivery.
The Last refresh date on this dashboard refers to the date and time when the data displayed on the dashboard was last updated or refreshed from the underlying data sources. You can know the data's freshness and make informed decisions based on the most recent information.
This dashboard is built using the blocked_backlog_item_throughput dataset.
Blocked Backlog Item Throughput
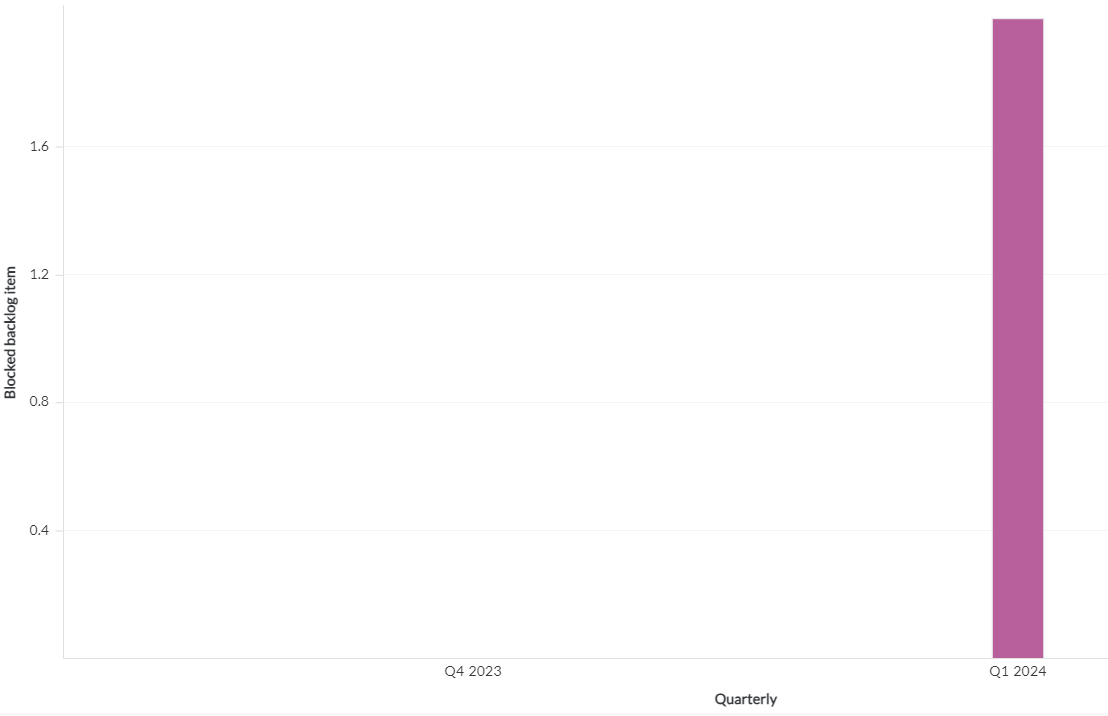
Displays the trend of blocked backlog items at a specific time. Each bar on this panel represents the total number of blocked backlog items in the period shown on the x-axis. Each bar is grouped by blocked backlog item type. The x-axis represents the calendar month or quarter, and the y-axis represents the blocked backlog item count. You can hover the cursor over a bar to view work item type, interval, and blocked backlog item count.
Here is an example blocked backlog item throughput panel.

You can filter and view the required data using the following filters:
- Planning level: Displays data of backlog items in the selected planning level and all child planning levels that belong to the planning level.
- The following filters display filter values based on the filtered planning level.
- The following filters cascade each other.
- Program: Displays data of backlog items in the selected program.
- Interval: Displays data of backlog items in the selected interval filter values like monthly and quarterly.
You can use these filters to refine the displayed data. For example, you can choose a program from the Program filter to see the corresponding dashboard. Here is an example program-filtered panel.
Components of dataset
The following components of the dataset are used in this dashboard:
Attributes
| Attribute Name | Description |
|---|---|
| Monthly | Blocked month of the backlog item |
| Quarterly | Blocked quarter of the backlog item |
| Work item type | Type of the work item |
Metrics
| Metric Name | Description |
|---|---|
| Blocked Backlog Item | Count of blocked backlog items. |