Analytics Grids
This topic explains about the Analytics grids in Agility.
Overview
Analytic Grids expand on the Quicklist reports available in the core Digital.ai Agility application. In addition to Quicklist features such as customization, filtering, sorting, and exporting; Analytic Grids give you the ability to group data and aggregate values and provides support for charts and cross tabulation tables. Finally, grid configuration can be saved and shared across the organization.
Analytic Grids are available for portfolio items, stories or backlog items, defects, test sets, tasks, tests, effort, and backlog matrix.
Accessing Analytics Grids
-
Click the hamburger menu
 > Analytics.
 -
Click Analytic Grids and select any of the following tabs:
-
- Portfolio Item
- Backlog
- Story
- Defect
- Test Set
- Task
- Test
- Effort
- Backlog Matrix
Common Grid Functionality
The following image, taken from the Story Grid, shows the common controls to all Analytic Grids. These controls are used to determine what data is presented and how that data is presented.
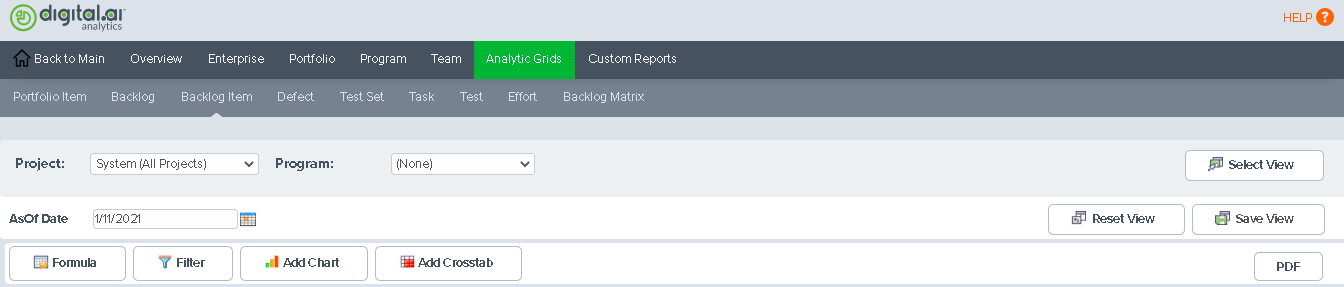
The following table describes the controls used to select the data presented in the grid.
| Name | Description | Default Value |
|---|---|---|
| Project | Determines which projects are considered. This filter is explained in more detail in the "Scope Selection" section on the Dashboards page. | Highest level project visible to the current user |
| Program | Determines which projects are considered. This control is only visible when your Digital.ai Agility instance contains Programs. This filter is explained in more detail in the "Scope Selection" section on the Dashboard page. | None |
| As Of Date | The date to be used when selecting data. | Today |
Managing Views
The following table describes the controls used to manage save view.
| Select View | Opens a dialog containing saved views. This dialog has two tabs, one that contains view you saved (My Views) and another that contains views saved by other people in your organization (Global Views). On the My Views tab, you can also delete views that you created. To select a view, click on the My Views tab or Global Views tab, and then click on a name. 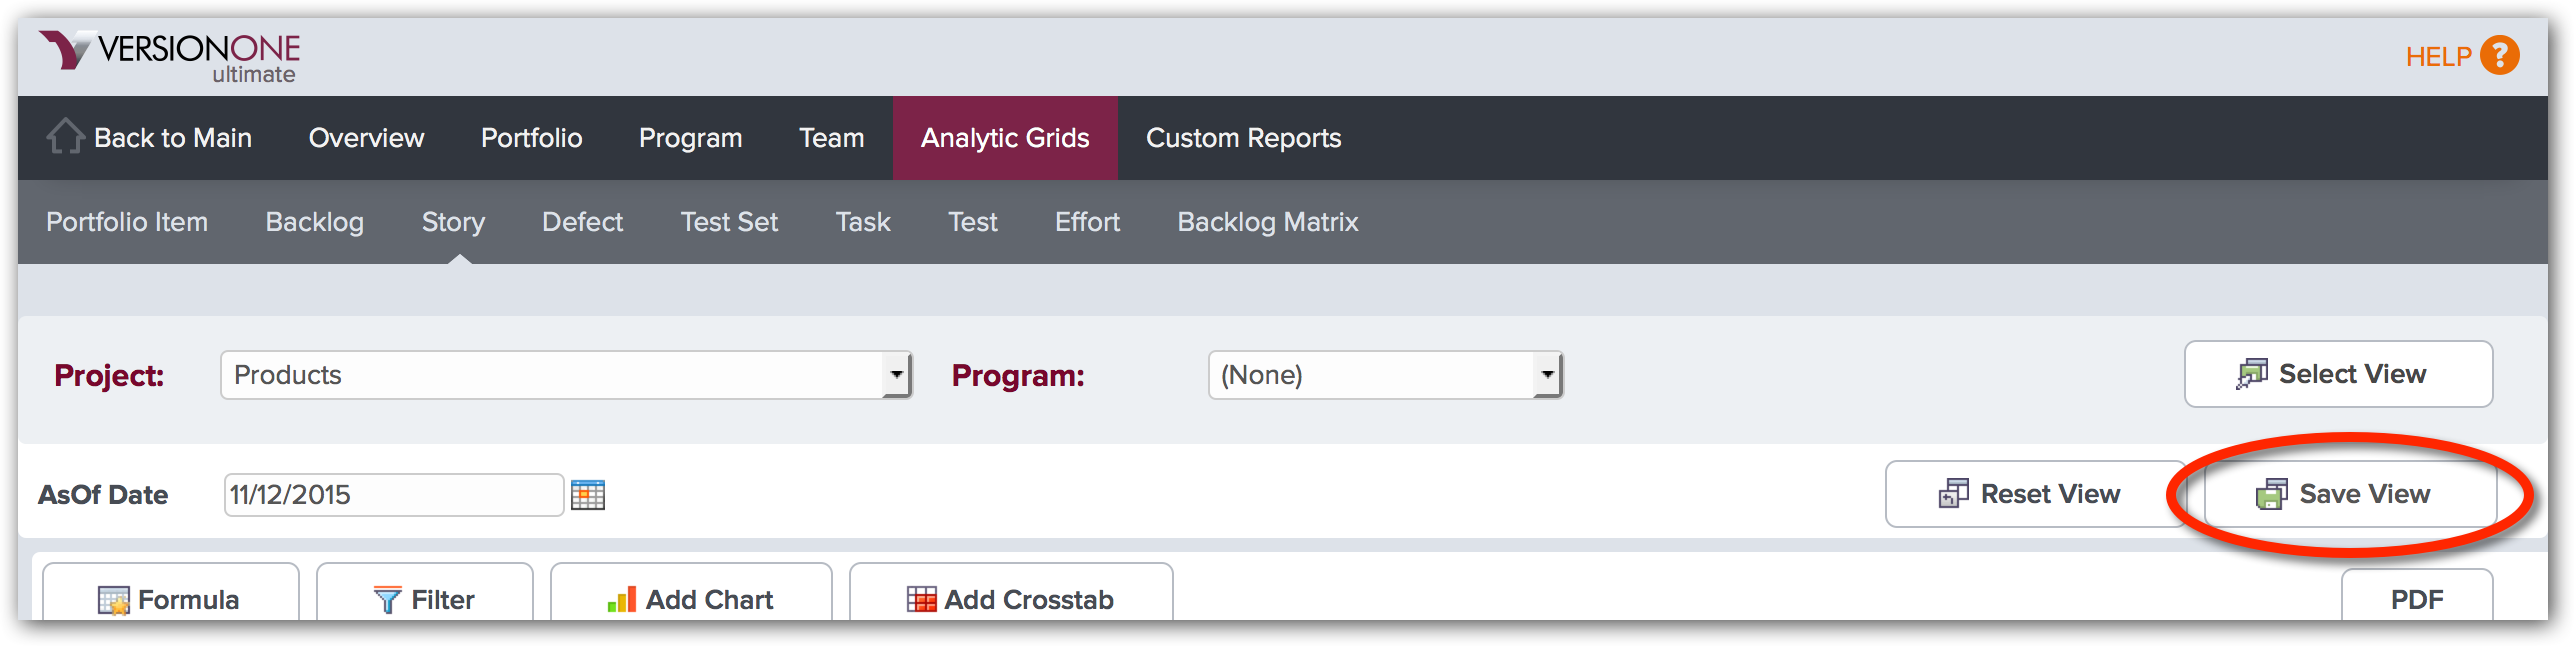 |
|---|---|
| Reset View | Reset the grids to the default view. |
| Save View | Save the current view. |
Customizing Data Presentation
The following sections describe the controls used to customize how data is presented.
| Formula | Allows you to add a custom column to the grid that is based on a formula. The Column Name is specified in the Name field and the Formula is specified in the Formula field. Use the "Insert a column" dropdown along with the "Insert" button to add columns to the formula. The "Data Type" and "Display Format" are used to control how the data is presented. Additional information on supported formula is available on the Formula Help page.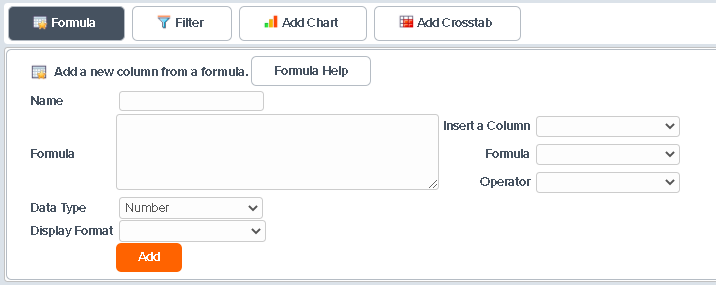 Filter | Allows you to filter the data visible in the grid.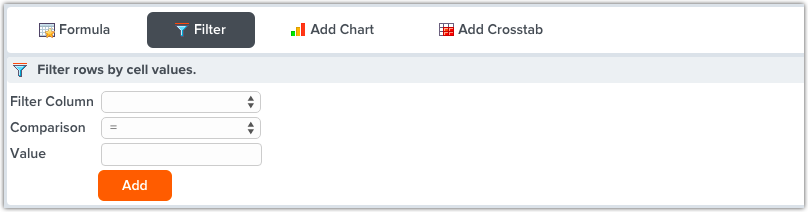 |
|---|---|---|
| Add Chart | Allows you to add charts to the grid page. Once you select a chart type, you are prompted for the data elements to include. Charts are added below the table by default, but can be moved to the top.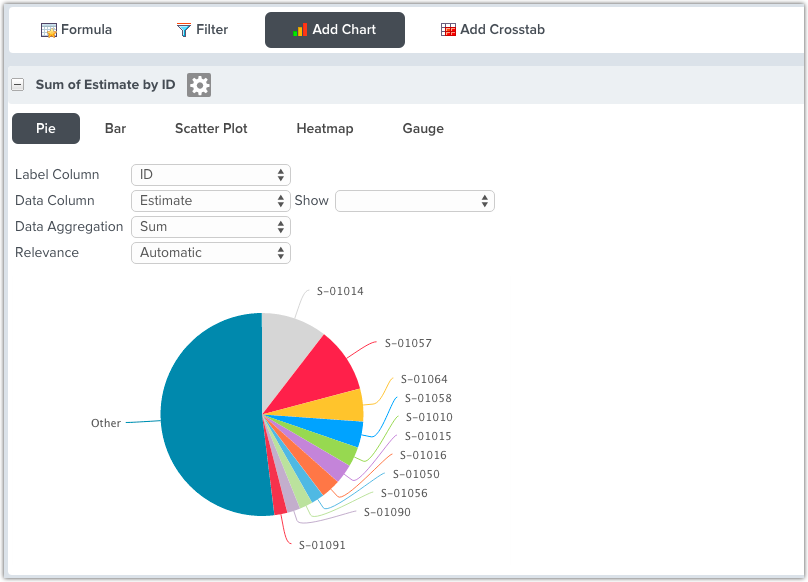 Add Crosstab |
Backlog Matrix
The Backlog Matrix presents a multidimensional view of Backlog Items, Defects, and TestSets.
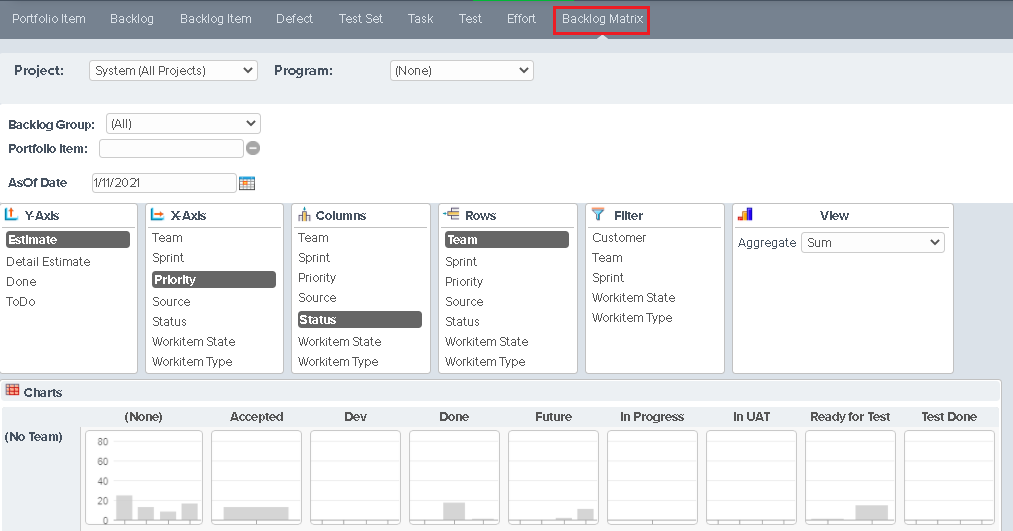
Each bar chart in the grid only includes the data represented by the row and column intersection. Using the controls at the top of the page, you can control: the x- and y- axes of the Bar chart, the aggregate function used to determine the bar height, the row and column grouping and you can filter the data presented.
Clicking on any chart opens a larger view of that chart.
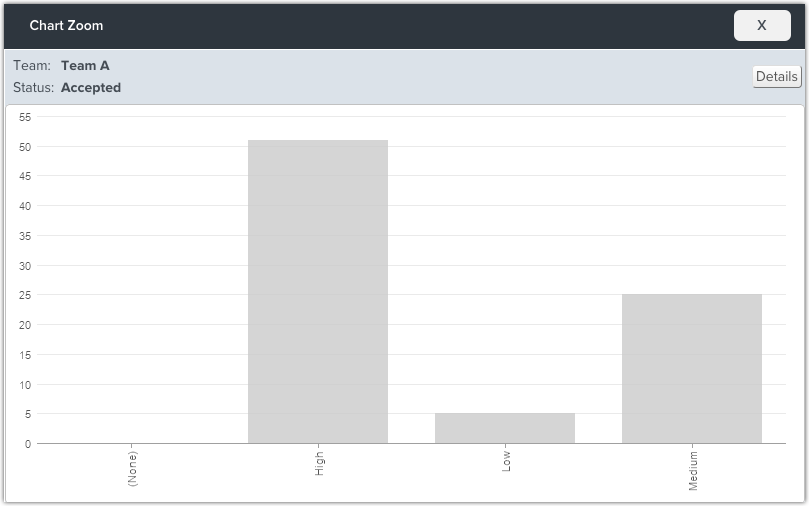
Clicking on the Details button, presents a table of the data that can be exported to Microsoft Excel.
Please note that Text Fields are not available in Analytic Grids. We do not display text fields on Grids because they are not trended over time and we use an AsOf date on the grids to look across time.