Agile Earned Value by Date

The Agile Earned Value by Date dashboard enables you to compare the planned work, actual progress, and delivered results in a project or planning level over time. The panel includes a bar graph representing the velocity, indicating how much work is completed during each period. This panel is an agile alternative to traditional earned value reporting in project or planning level management.
The Last refresh date on this dashboard refers to the date and time when the data displayed on the dashboard was last updated or refreshed from the underlying data sources. You can know the data's freshness and make informed decisions based on the most recent information.
This dashboard is built using the work_item_snapshot_weekly dataset.
Agile Earned Value by Date
Provides a visual representation of the project or planning level's progress over time. The x-axis represents the calendar date, and the y-axis represents the total estimate or work item count. This panel has the following trend lines:
- Target: This line represents the target or baselined work item count or total estimate for the selected project or planning level.
- Completed work items or story points: This line represents the total amount of project or planning level work item count or total estimate at the end of each iteration.
- Total work items or story points: This line represents the work item count or total estimate defined in the project or planning level on the first day of the project or planning level and at the end of each iteration.
- Guide Line: This line represents how much work would need to be delivered in each period to deliver the target estimate in the specified number of iterations.
- Velocity: This bar represents either the work item count or total estimate in each iteration, depending on the currently selected tab.
The grid displays details like calendar date, targeted work, velocity of each iteration, total estimate or total count of work items, and completed estimate or completed count of work items.
Here is an example agile earned value by date panel.
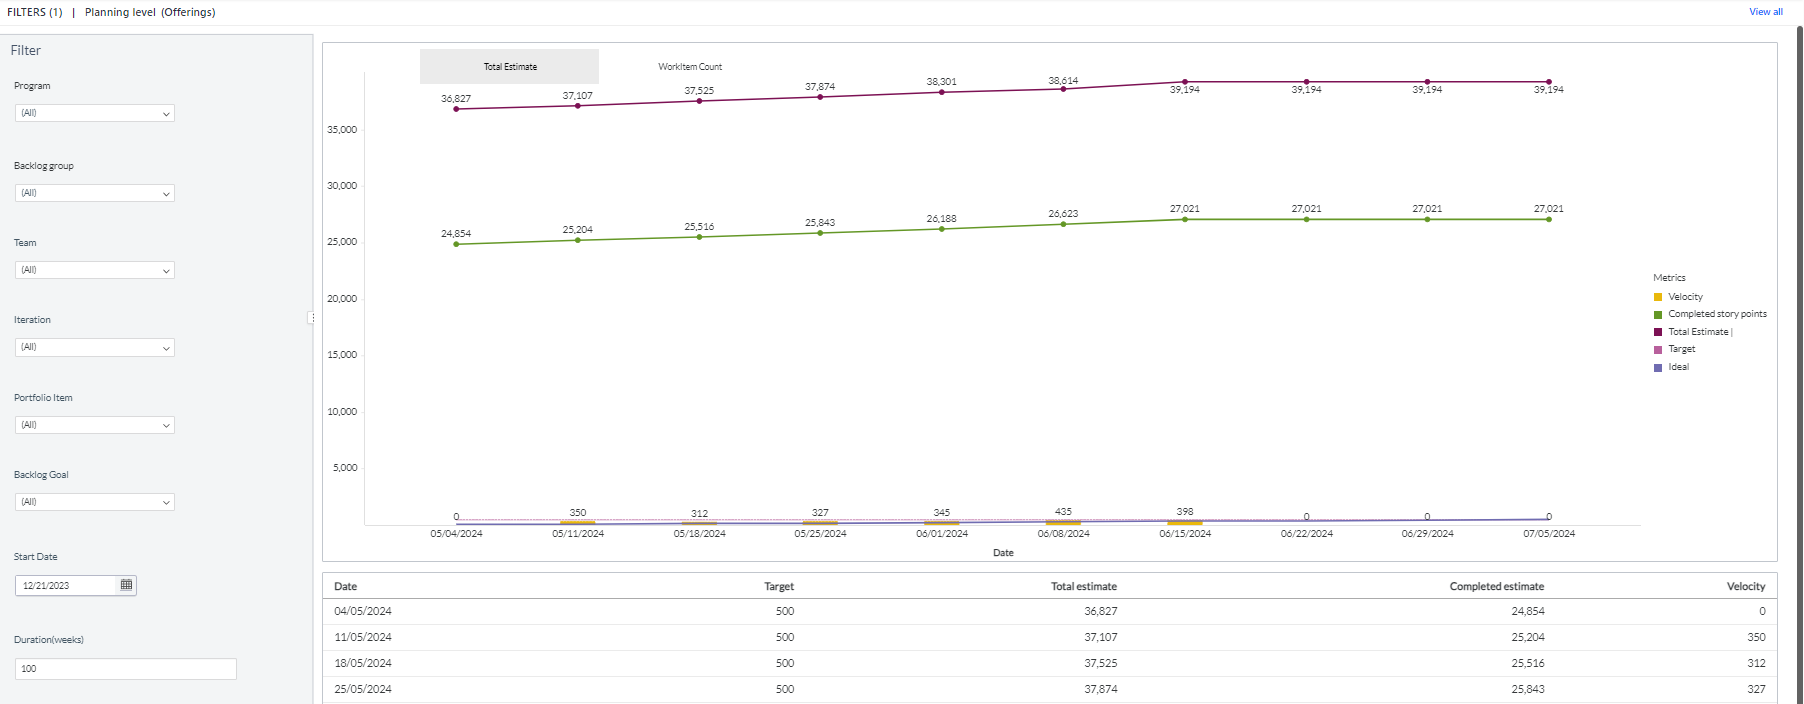
You can filter and view the required data using the following filters:
- Planning level: Displays data of work items in the selected planning level and all child planning levels that belong to the planning level.
- The following filters display filter values based on the filtered planning level.
- The following filters cascade each other except the Start date and Duration filters.
- Program: Displays data of work items in the selected program.
- Team: Displays data of a specific group of cross-functional members.
- Backlog group: Displays data of work items in the selected backlog group and child backlog group that belongs to the backlog group.
- Iteration: Displays data of a specific planning period for an Agile team.
- Portfolio item: Displays data of work items in the selected portfolio item and all child portfolio items that belong to the portfolio item.
- Backlog Goal: Displays data of work items in the selected backlog goal.
- Start date: Displays data of work items in the selected start date.
- Duration (weeks): Displays data of work items in the selected duration weeks like 50 weeks, 20 weeks, and 10 weeks.
- Target: Displays data of the selected target value.
- Group by: Displays data of work items in any of the following dimensions: total estimate and work item count.
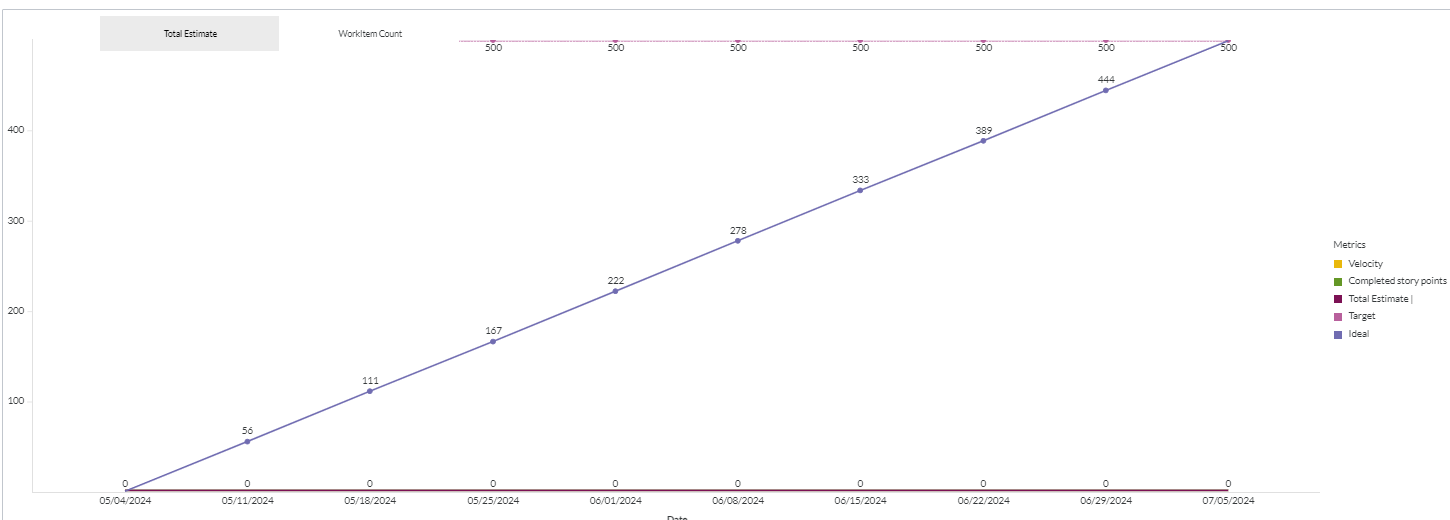
You can use these filters to refine the displayed data. For example, you can choose a backlog goal from the Backlog goal filter to view the corresponding dashboard. Here is an example backlog goal-filtered panel.
Components of dataset
The following components of the dataset are used in this dashboard:
Attributes
| Attribute Name | Description |
|---|---|
| Calendar date | Gregorian calendar date displayed in the format 'D/M/YYYY' |
Metrics
| Metric Name | Description |
|---|---|
| Completed story points | The total amount of project or planning level work completed at the end of each iteration. |
| Completed work items | The total amount of project or planning level work completed at the end of each iteration. |
| Guide Line | Work would need to be delivered in each period to deliver the target estimate in the specified number of iterations. |
| Target | Target or baselined work items for the selected project or planning level. |
| Total Estimate | Summation of all estimate points of the backlog item in the iteration. |
| Completed Estimate | Summation of all completed estimate points of the backlog item in the iteration. |
| Total count | Count of work items in an iteration. |
| Completed count | Count of completed work items at the end of each iteration. |
| Velocity | The total amount of work completed in each iteration. |
| Velocity work item | The total amount of work completed in each iteration. |