Agile Earned Value dashboard

The Agile Earned Value dashboard enables Agile teams to compare their release plan with the actual work completed. This dashboard helps teams to identify potential issues and ensure they stay on schedule and within budget. You can use the Agile Earned Value panel as an Agile environment alternative to traditional earned value reporting.
The Last refresh date on this dashboard refers to the date and time when the data displayed on the dashboard was last updated or refreshed from the underlying data sources. You can know the data's freshness and make informed decisions based on the most recent information.
This dashboard is built using the workitem_snapshot_daily dataset.
The Agile Earned Value dashboard consists of the following tabs:
- Total Estimate: This tab provides details of the Agile earned value based on the total estimates of the work items.
- Work Item Count: This tab provides details of the Agile earned value based on the work item count.
Here is an example Agile earned value panel.
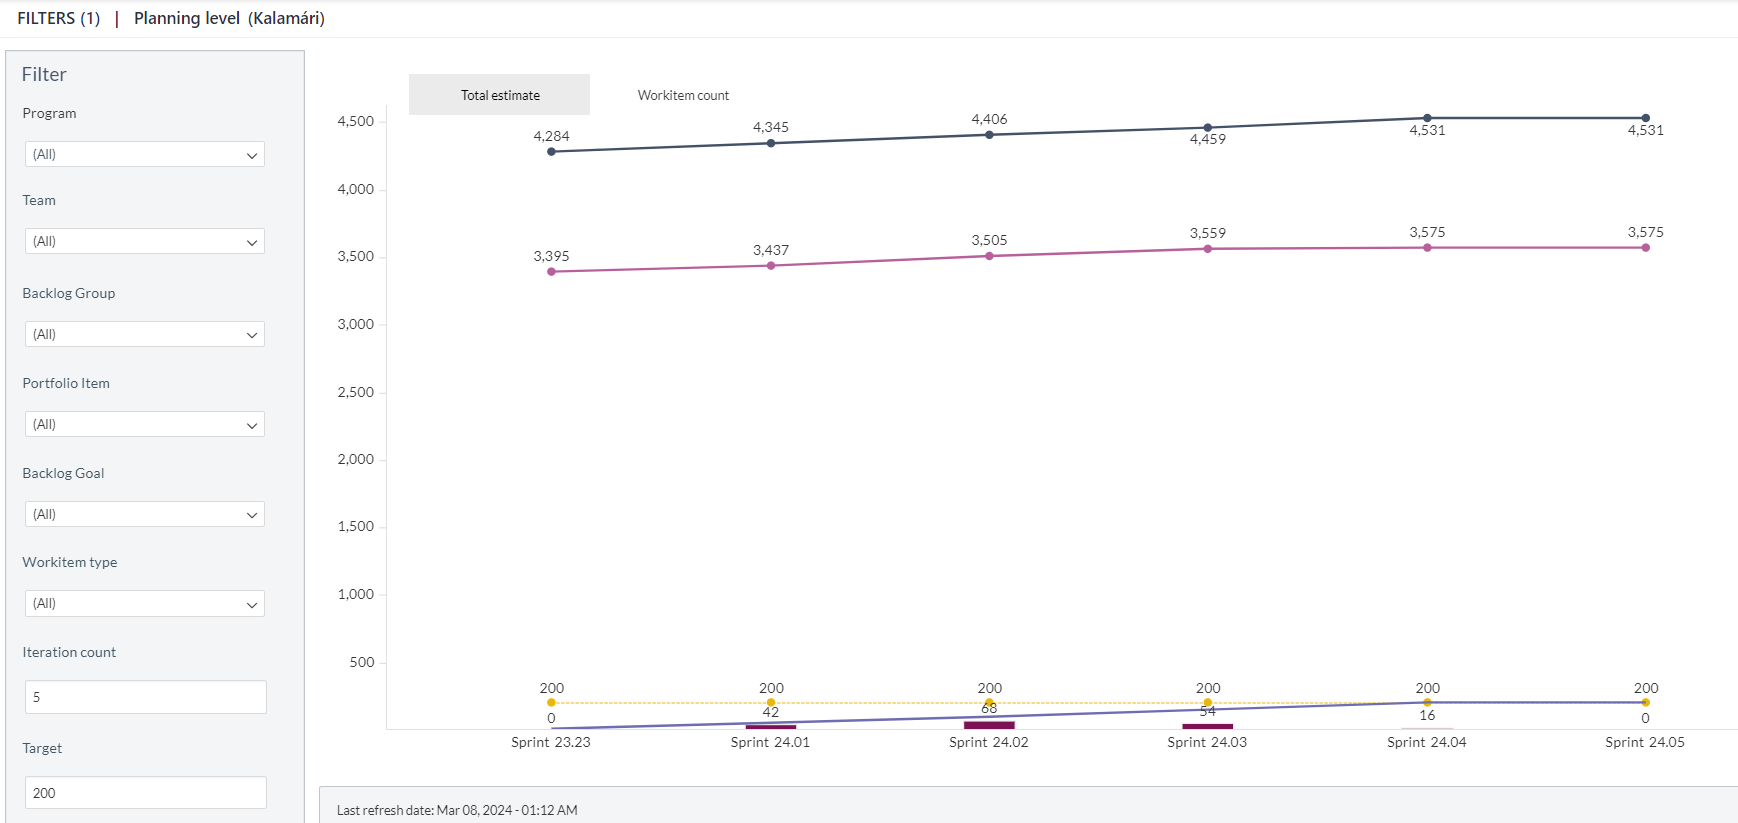
You can filter and view the required data using the following filters:
- Planning level: Displays data of work items in the selected planning level and all child planning levels that belong to the planning level.
- The following filters display filter values based on the filtered planning level.
- The following filters cascade each other except the Iteration count and Target filters.
- Program: Displays data of work items in the selected program.
- Team: Displays data of a specific group of cross-functional members.
- Backlog group: Displays data of work items in the selected backlog group and child backlog group that belongs to the backlog group.
- Portfolio item: Displays data of work items in the selected portfolio item and all child portfolio items that belong to the portfolio item.
- Backlog goal: Displays data of work items in the selected backlog goal.
- Work item type: Displays data of work items in any of the following types: story, defect, and test set.
- Iteration count: Displays data of work items in the selected iteration count such as 5, 10, and 50.
- Target: Displays data of work items within the selected target values, which is based on either the total estimate or work item count.
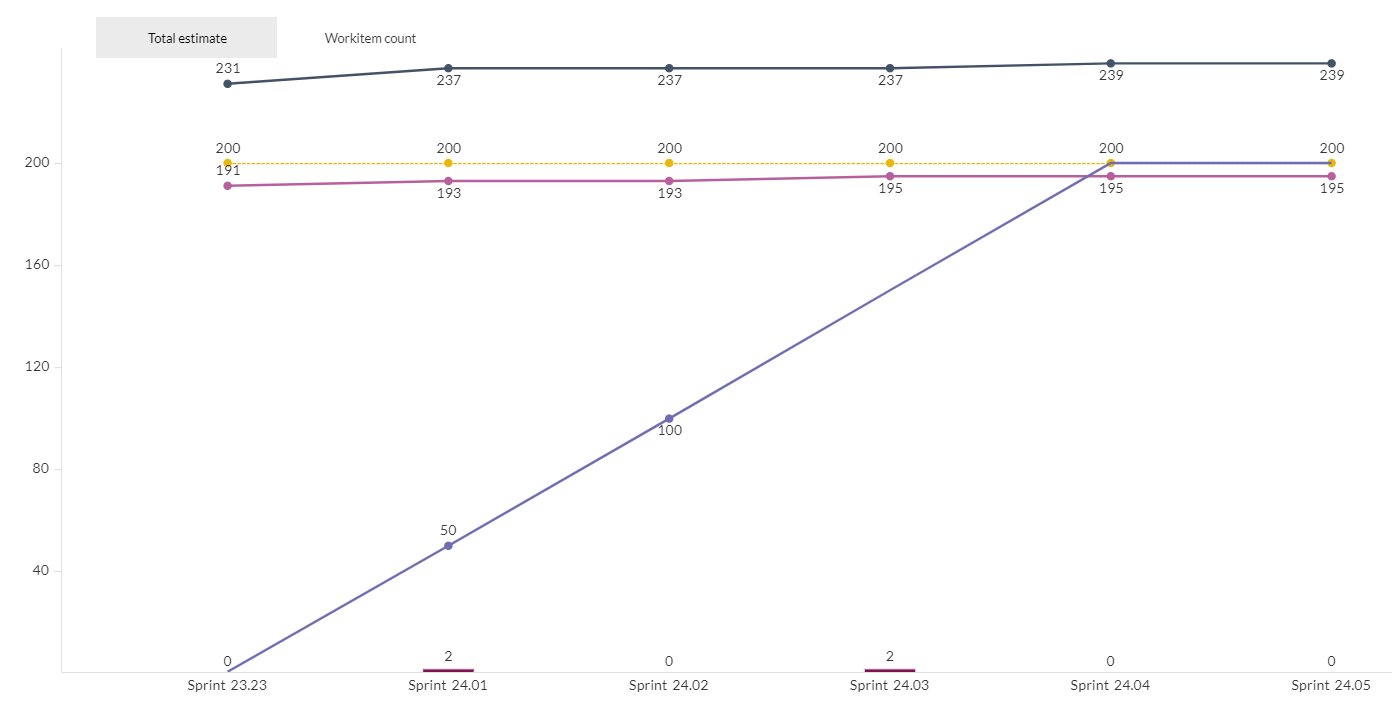
You can use these filters to refine the displayed data. For example, you can choose a program from the Program filter to view the corresponding dashboard. Here is an example program-filtered panel.
Agile Earned Value
Displays the trend of work items completed at the end of each iteration and those defined on the first day of the planning level. This panel also has a bar chart that displays the total number of work items completed in each iteration. The x-axis represents the iterations, and the y-axis represents the work item count or total estimate depending on the tab. You can hover the cursor over the graphs to see the iteration name and total and completed estimates or total and completed work item or target or ideal or velocity. This panel has the following trend lines:
- Target: This line represents the target or baselined work item count or total estimate for the selected project or planning level.
- Completed: This line represents the work item count or total estimate in the project or planning level at the end of each iteration.
- Total: This line represents the work item count or total estimate in the project or planning level on the first day of the project or planning level and at the end of each iteration.
- Ideal: This line represents how much work would need to be delivered in each period to deliver the target estimate in the specified number of iterations.
- Velocity: This bar represents either the work item count or total estimate in each iteration, depending on the currently selected tab.
Components used in this dashboard
The following components of the dataset are used in this dashboard:
Attributes
| Attribute Name | Description | Dataset | |:-------------|:------------| |Iteration| Name of the iteration|
Metrics
| Metric Name | Description |
|---|---|
| Completed estimate | Sum of estimate related to the completed work item |
| Complete work items | Count of work items completed regardless of estimate value |
| Ideal | Work needs to be delivered in each iteration |
| Target | Total amount of work defined for the selected project or planning level |
| Total estimate | The total estimate of work items defined at the end of each iteration |
| Total work items | Count of defined work items |
| Velocity | Count of work completed in the selected planning level or project |
| Velocity | Sum of estimate of related work items completed in the selected planning level or project |