Work with Grids
A grid is a tabular representation of data, organized in rows and columns. This page covers creating a grid and the capabilities that apply only to grids: sorting, outline mode, and copying rows. It's step 3 of the Build a Dashboard Workflow.
For what a grid is and how it fits into a dashboard, see Key Concepts. For the other visualization types, see Work with Visualizations.
Create a Classic Grid
You can create a classic grid in a dashboard.
-
Open a dashboard.
-
In the top toolbar, click Visualization
 .
. -
Choose Grid > Grid
 .
. -
In the Datasets panel, double-click attributes and metrics to add them to the visualization. A grid requires at least one attribute and one metric.
-
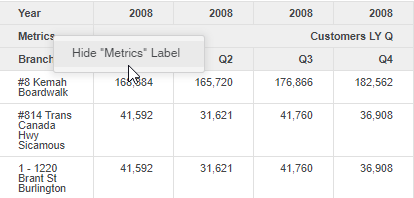
In some situations, a Metrics header is automatically generated. You can hide or show the text in this header, by right-clicking it and choosing Hide/Show "Metrics" Label.
Sort Data in a Grid
You can sort data in grid based on a single object.
-
Select a grid visualization.
-
In the Editor panel, right-click the attribute or metric to sort.
-
Choose Sort Ascending to sort the values in ascending order (that is, A to Z or 1 to 100).
or
Choose Sort Descending to sort the value in descending order (that is, Z or A or 100 to 1).
To sort the columns inside the Show Data dialog instead, see Show Data Dialog.
Enable Outline Mode for a Grid
You can enable outline mode to make grid visualizations easier to analyze.
- Create a grid visualization.
- Click View and then select Format Panel
 .
. - Under Visualization Options
 , select Layout.
 - Select Enable Outline. The grid appears in outline mode.
- Click the
 or
or  icons to expand and collapse attributes and display more or less detail. You can also expand or collapse an entire level by clicking the attribute header. The expand or collapse state of the attribute header is saved with the dashboard.
Copy Rows of Data from a Grid
You can copy rows of data from a grid and paste them into another application. This option is available only in the Windows version of Digital.ai Intelligence Applications.
- Select a grid visualization.
- Select the data you want to copy in the grid.
- Right-click and choose Copy Rows.
- Paste the rows into another application (for example, Excel) as necessary.
Next Step
Format and Lay Out a Dashboard — step 4 of the Build a Dashboard Workflow.