Dashboard Editor Reference
Field-level detail for the two dialogs in the dashboard editor that have more fields than a procedure can carry. This page supports the Build a Dashboard Workflow rather than sitting at a numbered step in it.
For the procedures themselves, see Work with Grids and Apply Thresholds.
Show Data Dialog
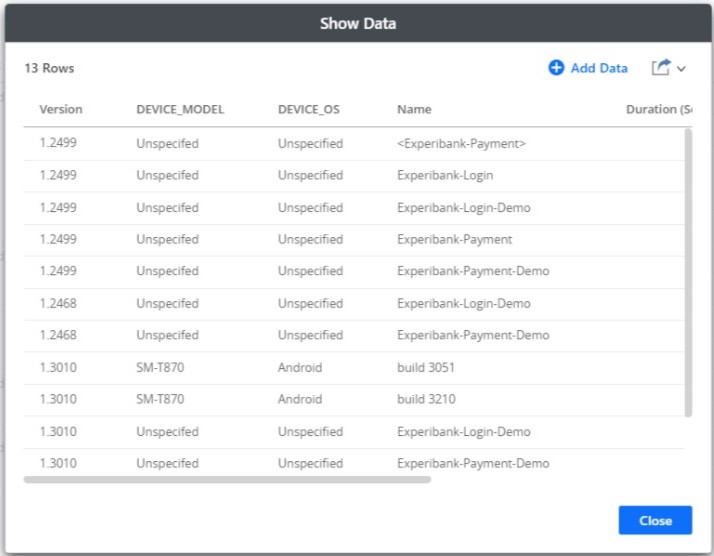
Use the Show Data dialog box to examine the underlying attribute and metric data of a visualization in a simple grid format.
Access
To access the Show Data dialog:
- Select a grid visualization.
- Click More
 in the top right of the visualization and choose Show Data.
You can also preview data by selecting a grid or panel visualization and then clicking Show Data from the three-dot menu.
Fields
-
Add Data: Click to add data from the visualization's primary dataset to the grid.
-
Rows: Displays the number of rows in the grid.
-
Export Data: Select this drop-down to export the data on this dialog to Excel, PDF, or CSV format.
-
Add as Grid: Click to create a new grid visualization using the data in the grid.
-
Grid: Displays the underlying data for the selected area of the visualization. You can perform the following actions in the grid:
- Resize columns by clicking and dragging column edges.
- Reorder columns by clicking and dragging headers.
- Sort columns by selecting the drop-down in the column header and choosing Sort Ascending or Sort Descending.
- Copy the grid data to the clipboard so you can paste it into another application. Click on a row to select it for copying. Press and hold the
CTRLkey to select specific rows. Press and hold theSHIFTkey to select consecutive rows. Then pressCTRL+Cto copy the data to the clipboard.
Note: The Show Data dialog box is not available for visualizations created using the data in a dataset imported from a server.
Advanced Thresholds Editor
The Advanced Thresholds Editor displays a list of all thresholds currently defined for the visualization. Use thresholds to format data in a visualization based on multiple attribute or metric qualifications.
Pre-requisites:
- Your dashboard must contain a grid visualization. You can only use the Advanced Thresholds Editor for grid visualizations. See Create a Classic Grid.
- You have placed a metric in the Metrics area or an attribute in the Rows or Columns area.
Access
To access the Advanced Thresholds Editor:
- In the Editor panel, right-click an attribute or metric and choose Thresholds. If you select an attribute, the Advanced Thresholds Editor opens. If you select a metric, the Quick Thresholds Editor opens.
- If you opened the Quick Thresholds Editor, select the Advanced Thresholds Editor link to open the Advanced Thresholds Editor.
Fields
New Threshold: Select this link to add a new threshold.
Order: Displays the order in which the system evaluates a threshold. Click and drag a threshold to reorder it.
Threshold Conditions: Displays the threshold conditions. Select a threshold condition to edit its corresponding metrics, attributes, filter options, qualifications, operators, elements, or values.
Add Condition: Select this link to add a new condition.
Group Conditions: Select this link to group conditions together. A threshold must contain multiple conditions for this link to appear.
Operator: Select the drop-down between conditions and choose an operator for combining conditions (for example, AND, OR, AND NOT, and OR NOT). A threshold must contain multiple conditions for this drop-down to appear.
Format Preview: Displays a preview for displaying data that meets the threshold's condition. Click on the preview to select formatting options for the condition. Click More to perform the following actions:
- Apply to: Select whether to apply the condition to Metrics Only, Subtotals Only, or Metrics and Subtotals that meet the threshold conditions.
- Formatting: Allows you to select the following formatting options for the condition:
- Replace Data: Select the Enable Data Replace checkbox to replace the data that meets the threshold condition with the options in the corresponding drop-downs.
- Font: Select font formatting options.
- Color and Border: Select fill color and border options.
- Duplicate: Adds a copy of the current condition to the end of the list.
- Move Up/Move Down: Change the order in which the system evaluates a condition by moving it up or down in the list.
- New Condition: Add a new condition to the end of the list.
Quick Thresholds Editor: Select this link to open the Quick Thresholds Editor.
To create a threshold, see Apply Thresholds.