Add Text, Images, and Shapes
This page covers the dashboard objects that aren't visualizations: text, images, and shapes. It's step 5 of the Build a Dashboard Workflow.
For what these containers are and how they fit into a dashboard, see Key Concepts.
Add a Text Field
- In the dashboard's toolbar, click Text
 .
The text field is automatically added to the dashboard and your cursor placed in the field.
.
The text field is automatically added to the dashboard and your cursor placed in the field. - Add text in field by typing the text you want to display.
- Click outside of the text field to save your text.
Add Rich Text
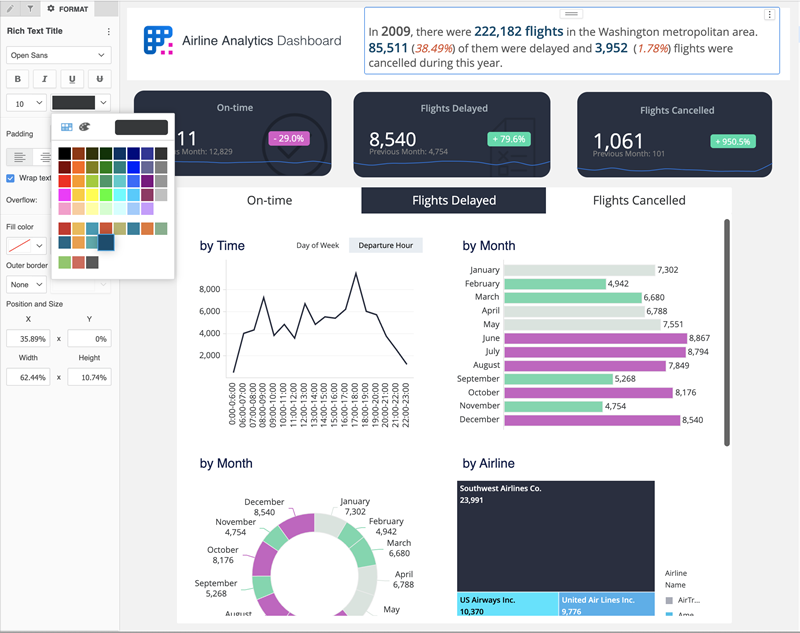
Unlike regular text fields, you can use rich text to apply rich formatting to the individual character level to create compelling infographic style dashboards.
Important: Autosizing stops at a six point font before a scroll bar is introduced. This is to prevent cases where a string of text ends up being shrunk to an unreadable size. To prevent the scroll bar from appearing, expand the container size to give the text more room.
-
In the top toolbar, choose Text
> Rich Text.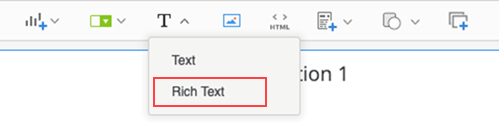
-
In the text box, type or paste your text.
-
Highlight your text and use the Format panel to modify your rich text.
Edit, Move, Resize, or Delete a Text Field
Edit a Text Field
To edit a text field, click the text field and enter the new text to display.
or
Click More  and choose Edit to highlight the current text. Type the new text to display.
Move a Text Field
To move a text field, drag it to a new location. A blue indicator line appears in the location where you can place the text field. Release the mouse button to place the text field in the new location.
Resize a Text Field
To resize a text field, hover the cursor over its edge. Drag the edge to change the size of the text field.
Delete a Text Field
To delete a text field, hover over it, click More , and choose Delete.
Add an Image
You can add either a URL or an embedded image to the dashboard.
- Embedded images are portable and are available when the dashboard is opened offline. The dashboard initially displays with embedded images shown as placeholders, since the images are loaded last. Images larger than 3 MB are compressed, unless they are a GIF file. If the compression does not result in a file smaller than 3 MB, the image cannot be embedded. Use a URL to specify the image's location instead. Only one copy of each image is included in the dashboard file, even if the image is used on different chapters.
- Large images (over 10 MB or a GIF file over 3 MB) should use a URL rather than embedding.
- In the dashboard, in the toolbar, click Image
 . A placeholder is automatically added to the dashboard and displayed in an image container.
 - To embed the image in the dashboard, click Browse in the image container. Navigate to and select the image and click Open. You can also drag and drop an image file into the image container. Note: Embedding images is recommended because it ensures that the image can be commonly accessed outside of Web. or To specify the image location using a URL, enter the URL of the image in the Enter an image URL field and click OK. Note: Both absolute URLs (https://www.example.com/etc/logo.jpg") and relative paths (such as "/images/logo.jpg") are supported, but relative paths are not recommended. Relative paths point to locations that are relative to the application that they were originally created for.
- To move the image, click and drag the image to its new location in the dashboard. An indicator line appears in the location where you can add the image. Release the mouse button to place the image in the new location.
Add a Shape
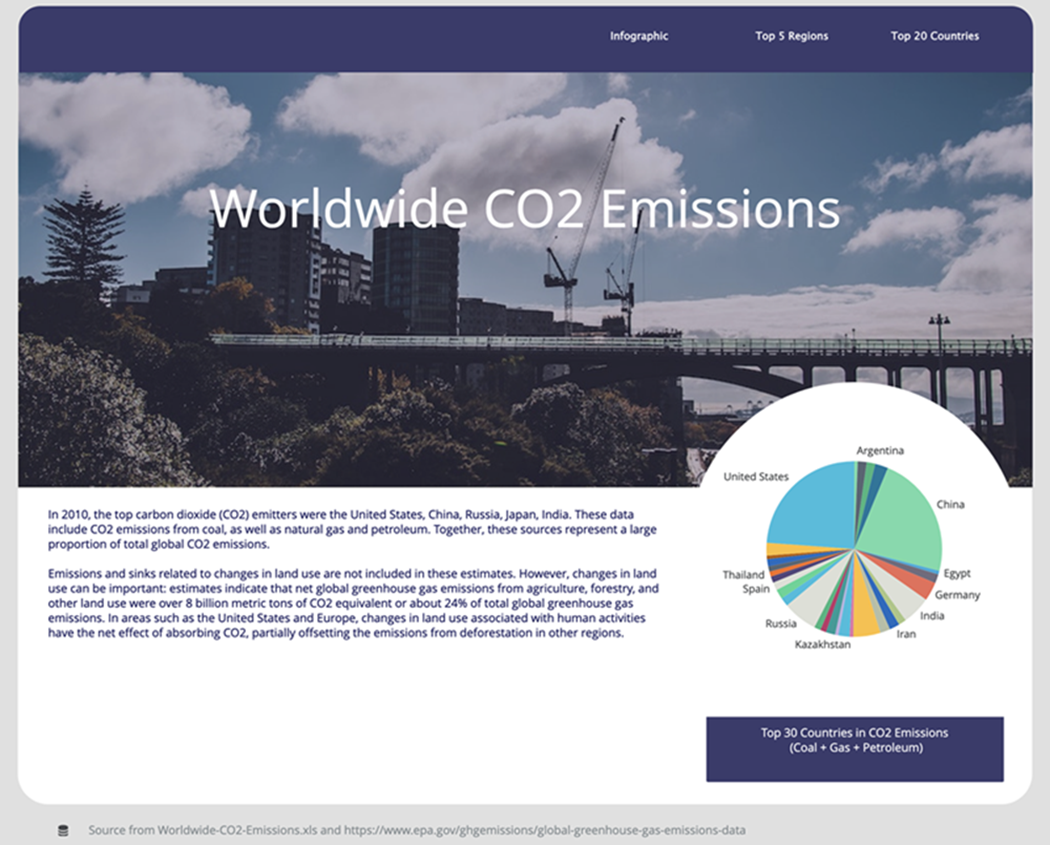
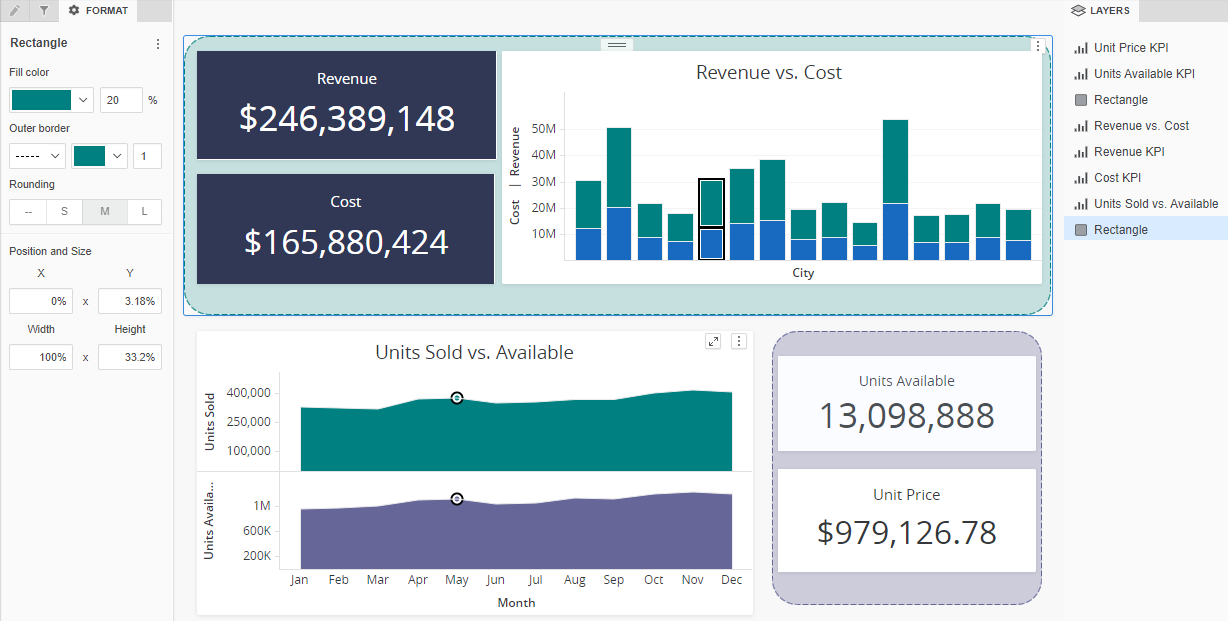
Use shapes in your dashboard to help frame a visualization, create a layered effect, or visually group elements together.
-
Open a new or existing dashboard.
-
In the top toolbar, click Shape
 .
. -
Select a shape:
- Line
- Rectangle
- Ellipse
- Triangle
- Polygon
-
Click and drag where you want the shape to appear.
Info: If a shape overlaps another container, you can resize and reposition it by right-clicking on its layer and selecting Hide on Default View from the Layers panel.
-
Use the options in the Format panel to customize your shape.
Next Step
Organize Chapters and Pages — step 6 of the Build a Dashboard Workflow.