Add Filters and Interactivity
This page covers controlling which visualizations a filter affects, and adding information windows that give a data point extra context on selection. It's step 8 of the Build a Dashboard Workflow.
For how chapter and visualization filters relate to each other, see Key Concepts.
View and Edit Visualization Filter Targets
You can view and edit visualization targets. Targets include both visualization and filters that are affected by a visualization filter.
- Open the dashboard you want to modify.
- Select the chapter that contains the visualization.
- Hover over visualization, click More
 in the top right, and choose Select Target.
A pop-up menu appears. The targeted visualizations and filters appear with checkmarks.
in the top right, and choose Select Target.
A pop-up menu appears. The targeted visualizations and filters appear with checkmarks. - Select the checkboxes that correspond with the visualizations and filters you want to target.
- Deselect the checkboxes that correspond with the visualizations and filters you no longer want to target.
Add an Information Window
You can add information windows to your dashboard to enhance the visual interactivity for the user. Information windows allow you to include additional context that is critical to the data point without overcrowding the canvas.
-
In the top toolbar, click Information Window
 .
.The Information Window editor appears. You can return to the dashboard canvas by selecting an element under Canvas in the Layers panel.

-
Add visualizations, text boxes, images, panel stacks, and any dashboard object to your information window.
The information window elements appear under Information Windows in the Layers panel. Navigate to a specific element by selecting it.

-
To change the visualization type, right-click the information window > Change Visualization.
-
To format the information window and its title, container, and other elements, go to the Format panel.

You can control the window positioning for when it is triggered.
Info: The Left, Right, Top, and Bottom positions are in relation to the selected data point. If there is not enough space in the specified position based on the selected point, the information window automatically displays in a position where there is enough space.

-
In the Format panel of a Panel element, choose between Free-form Layout and Auto-Layout.
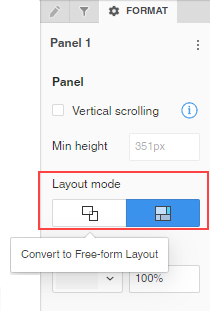
-
Add a Close button to control how your users dismiss the information window.

-
From the dashboard canvas, select a visualization, text box, or image that should trigger the information window.
Info: To trigger an information window for a Time Series visualization, use the horizontal selector to choose your desired data point(s). This includes a range of 1 to pass one data point.
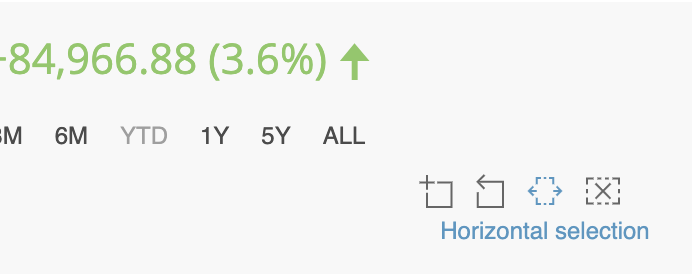
-
In the upper right corner of the visualization, text box, or image, click More
> Select Target Info Window.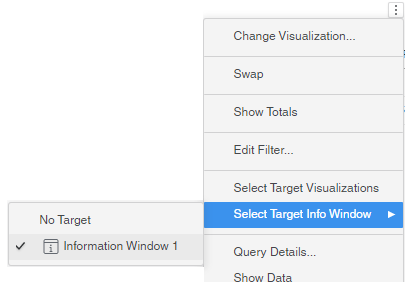
-
Select the information window.
-
To pass in-canvas filters and visualizations as filters to target the information window source visualization, right-click the information window > Apply Additional Filter Conditions.
Now, when you click on the visualization, text box, or image, the relevant information window appears and passes the selected element.
Next Step
Save, Publish, and Manage a Dashboard — step 9, the last step, of the Build a Dashboard Workflow.