Build a Dashboard
This page covers creating a dashboard, giving it data, and linking attributes that several datasets share. It's step 1 of the Build a Dashboard Workflow.
For the terms used here, see Key Concepts.
Create a Dashboard
Click Create Dashboard to create a new customized dashboard.
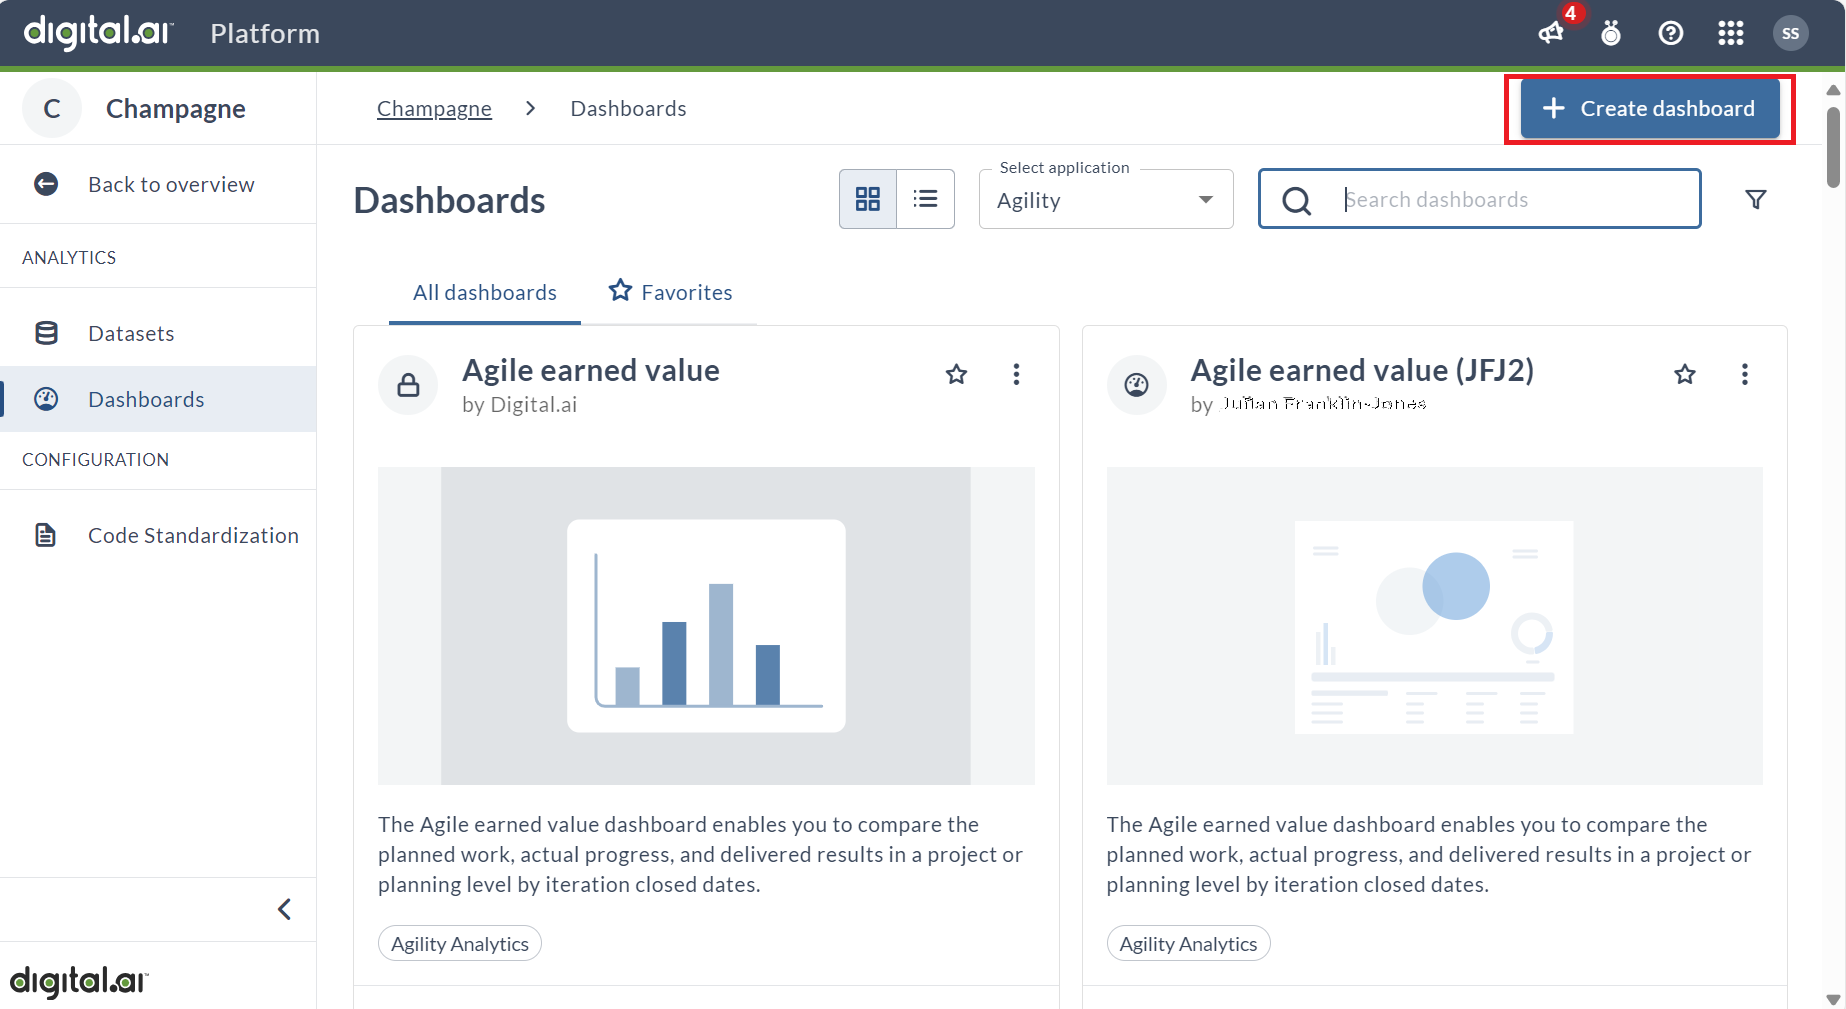
In the dashboard creation process, it is mandatory to provide a Dashboard name, as it serves as a unique identifier for the dashboard. However, filling in the Description and Category fields is optional, allowing users the flexibility to provide additional context and categorization if desired. Once the required Dashboard name field is populated, Click Continue.
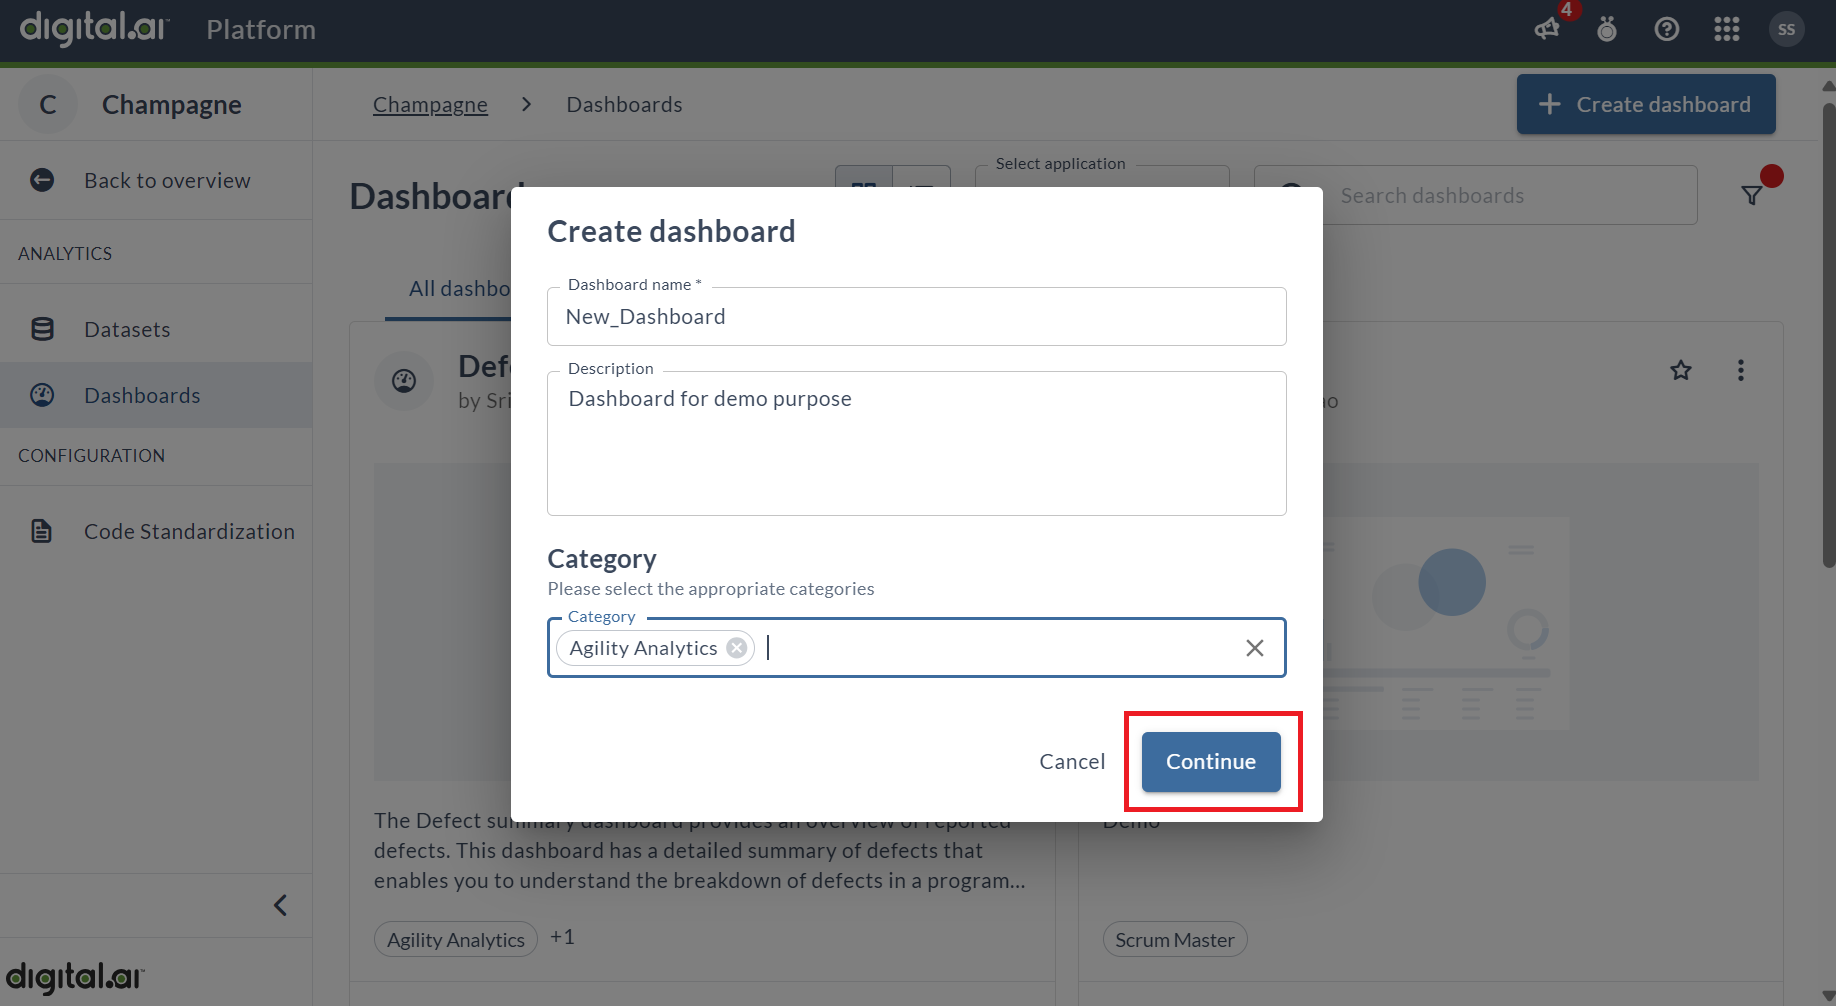
For each dashboard to function effectively, it requires a reliable source of data. In the context of Digital.ai Analytics, datasets serve as the foundational structures for organizing and presenting this data. Digital.ai has a diverse array of datasets to support various use cases, ensuring that users have access to relevant and structured information. Additionally, depending on your licensing agreement with us, you may be granted the ability to create and customize your own datasets, tailored to meet your specific needs. Click View and then select the Datasets Panel to create a dashboard using datasets.
For more information about datasets, see Datasets.
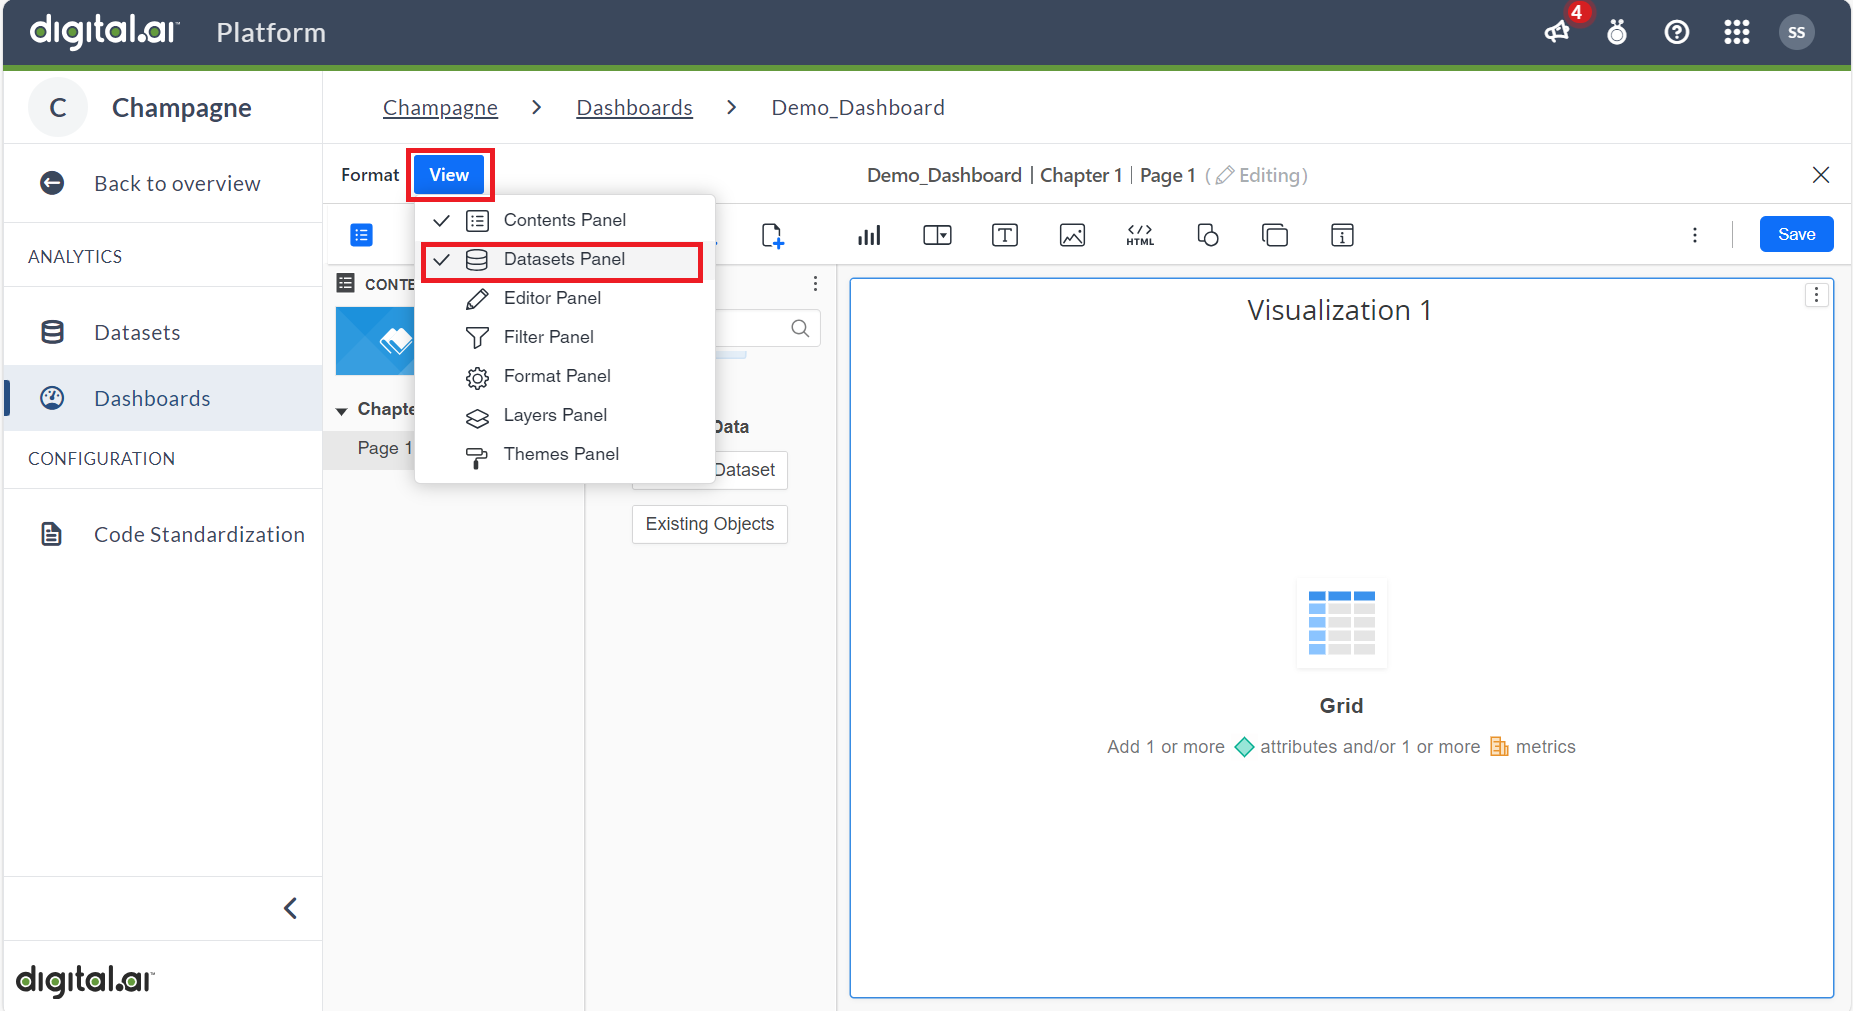
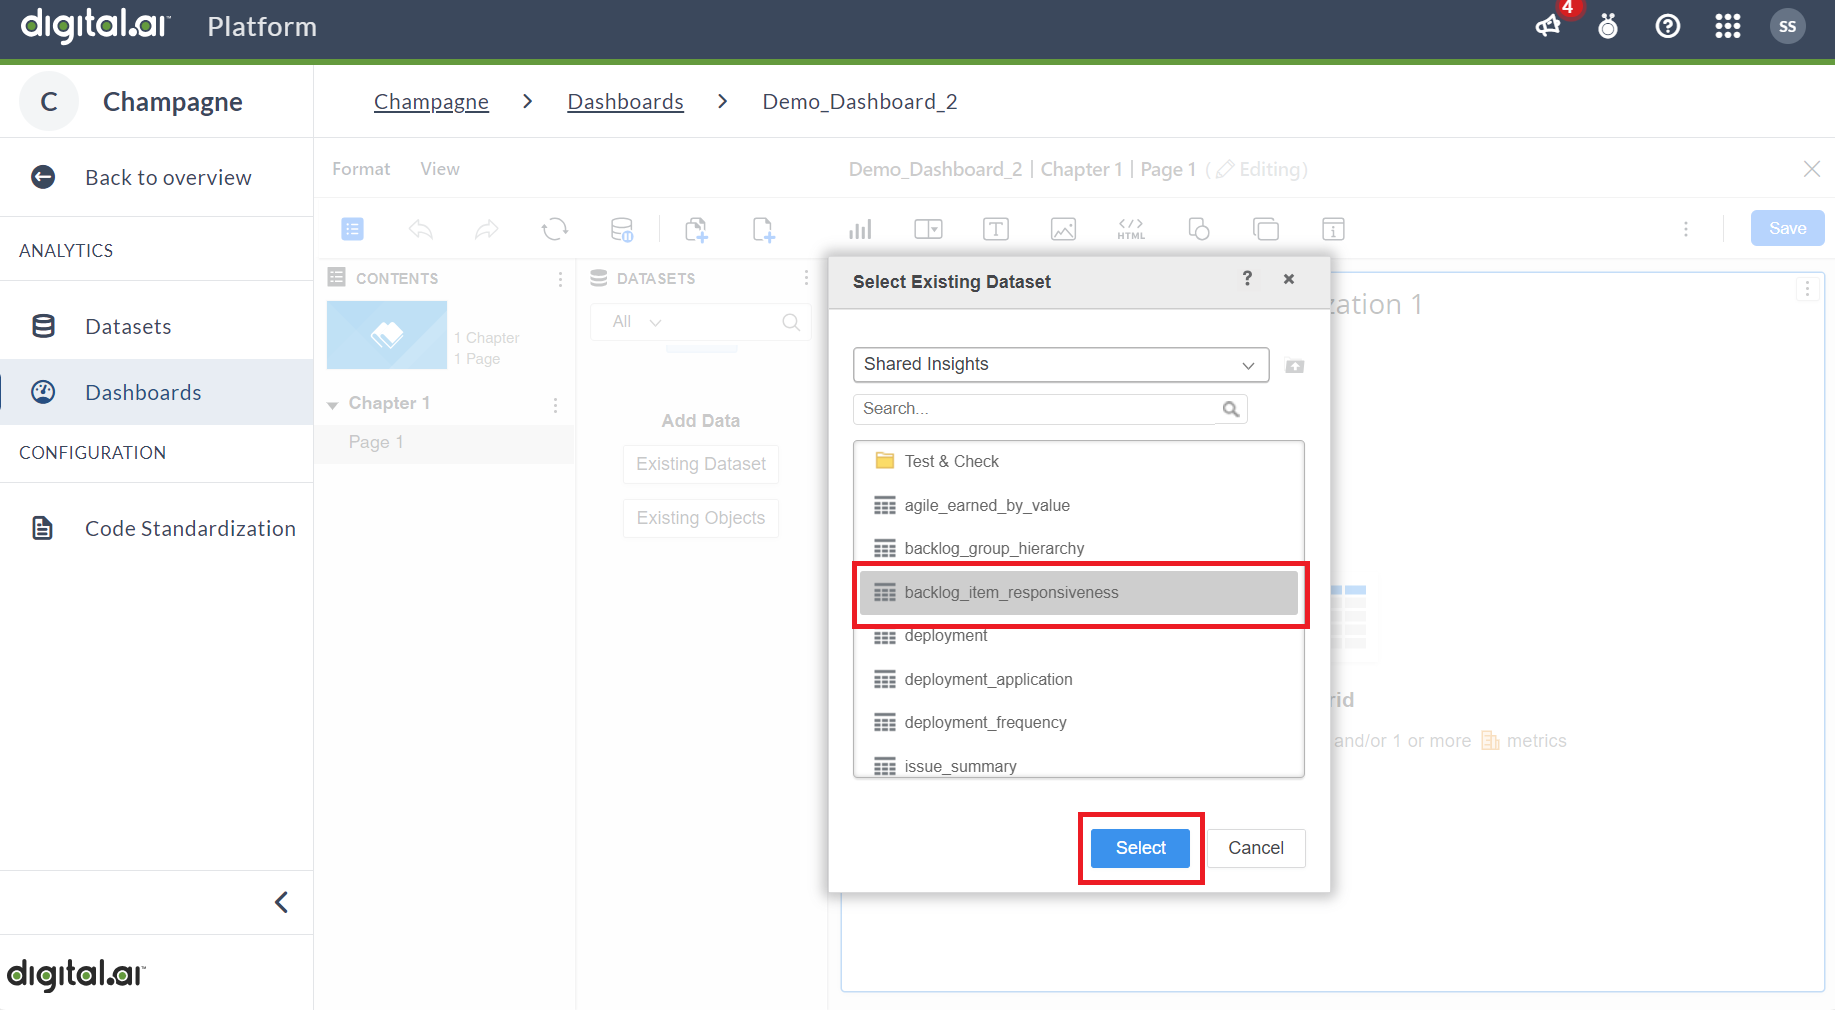
Click Existing Dataset to create a dashboard.
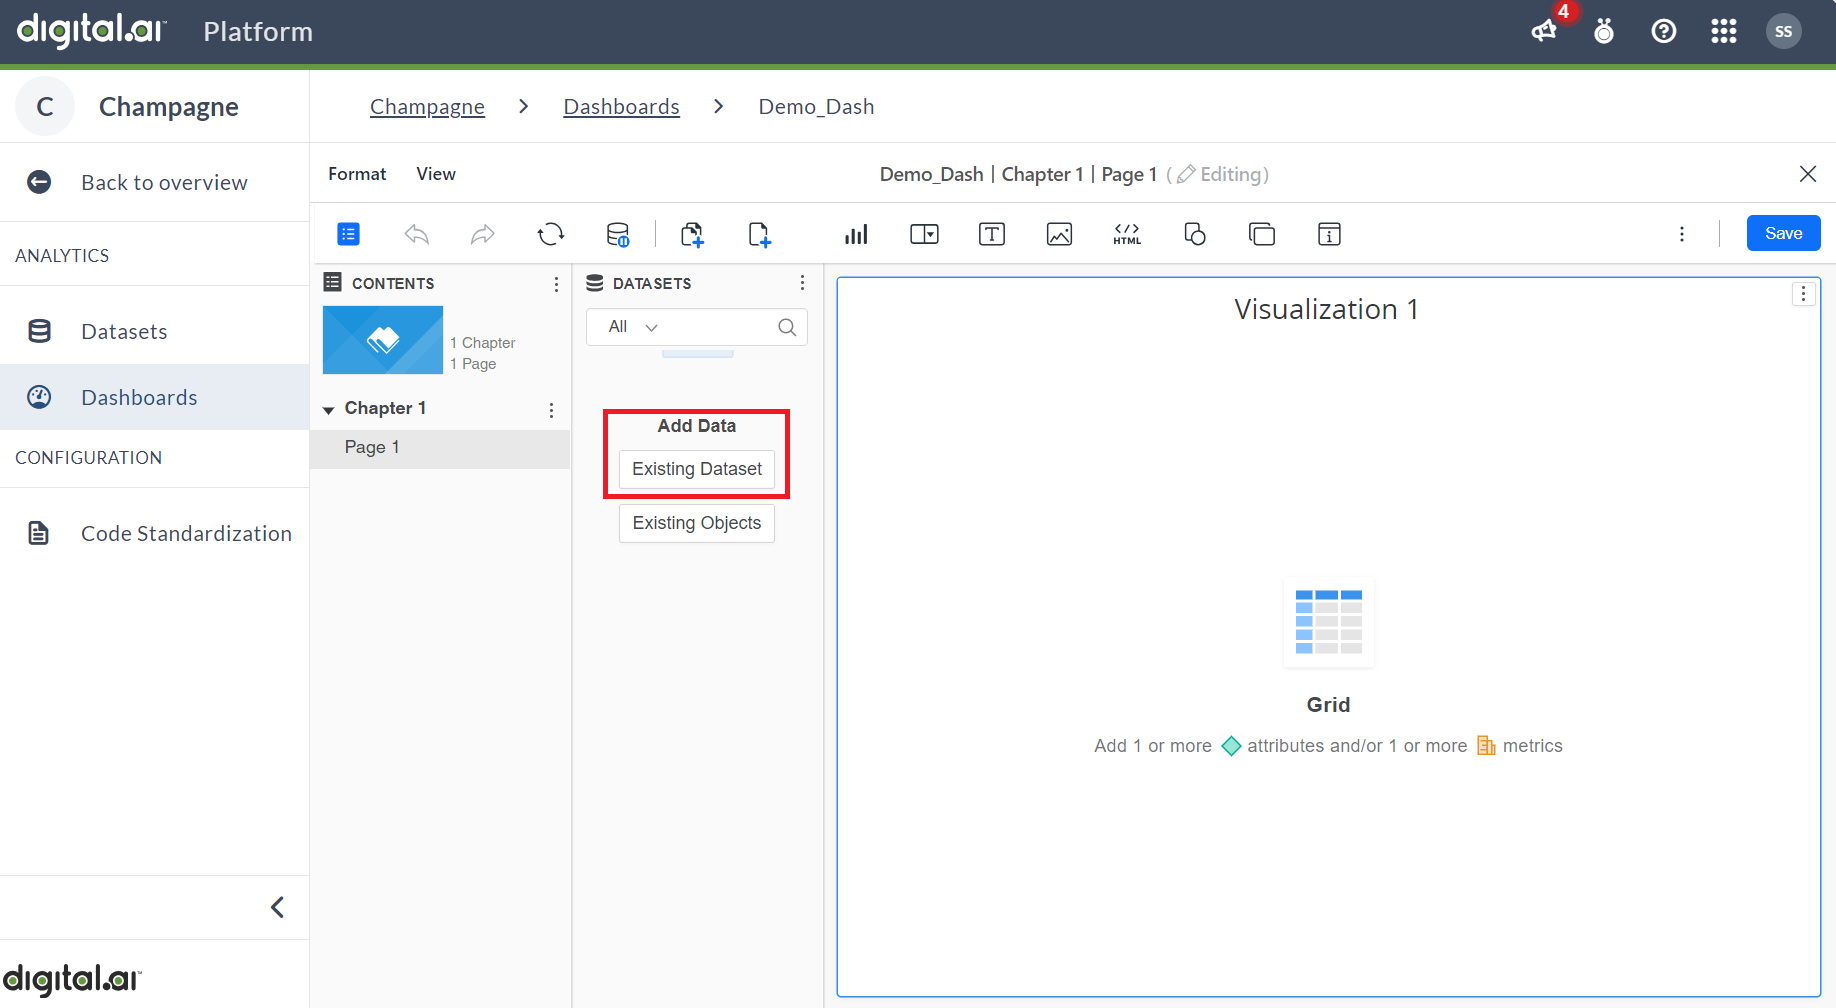
To proceed further, click on the required dataset from the list of available datasets and then click Select option.
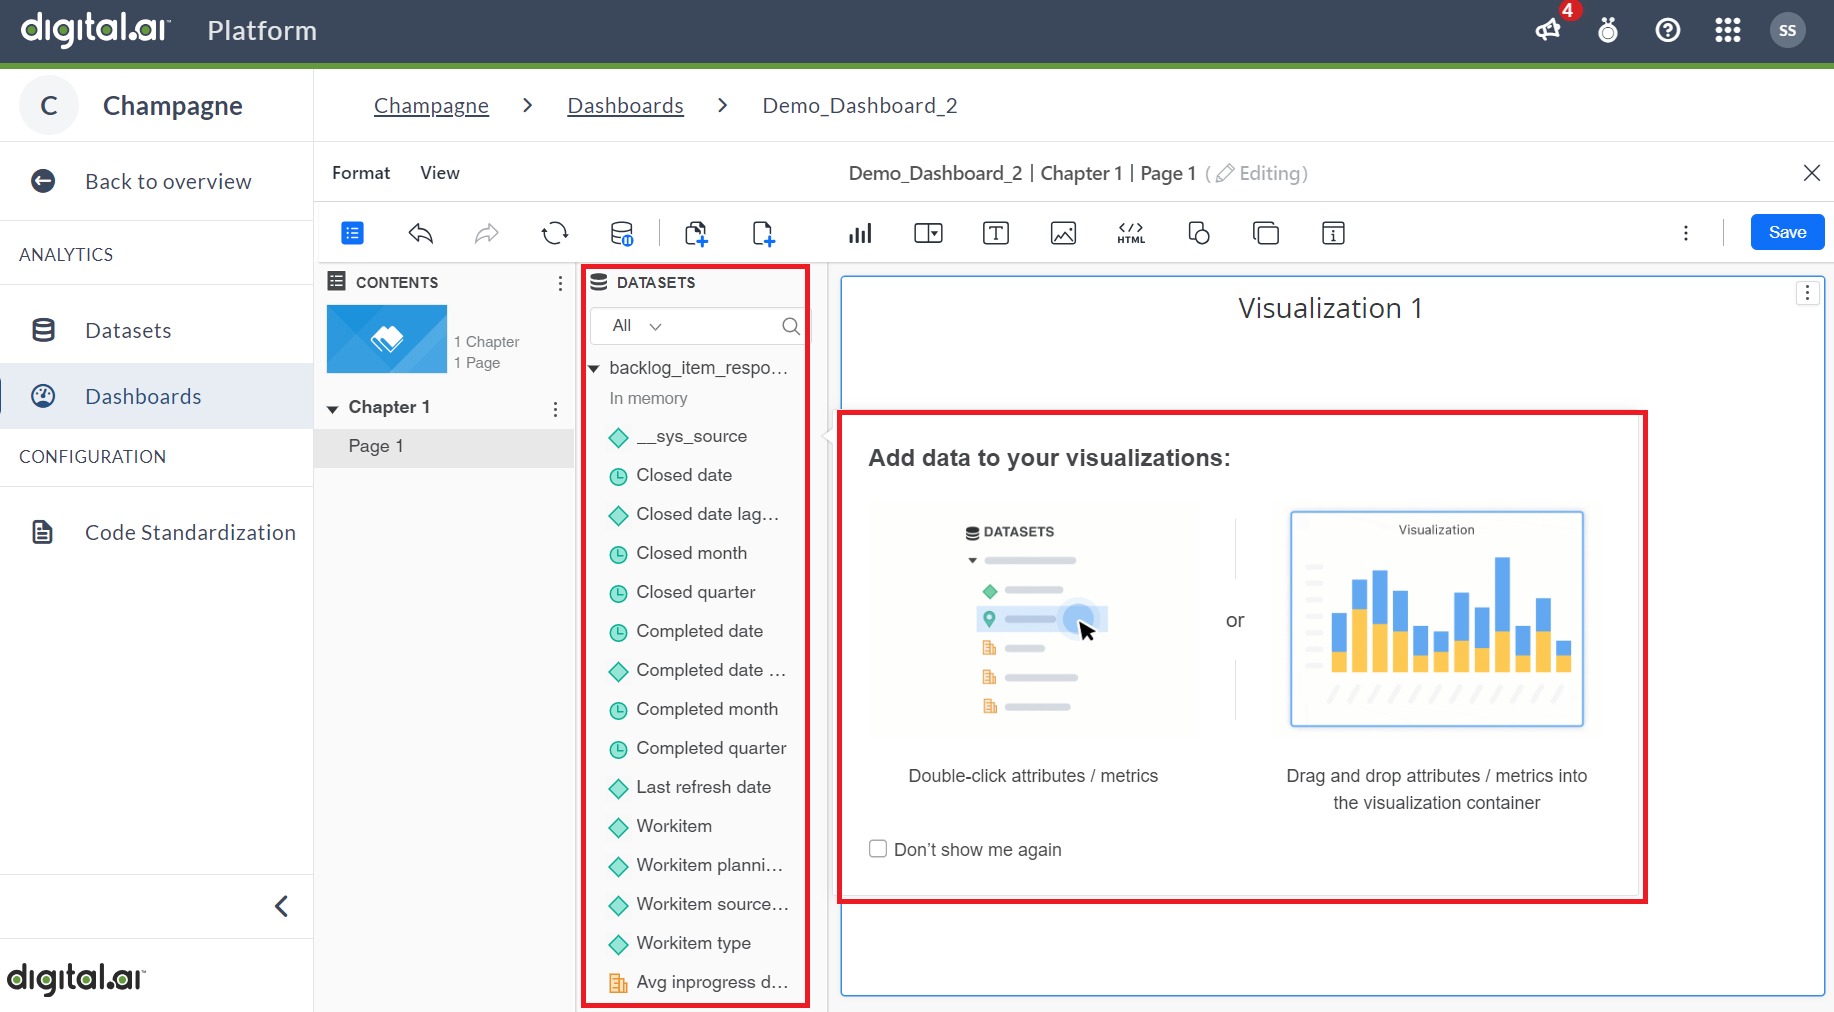
Double-click on the required attributes to select them.
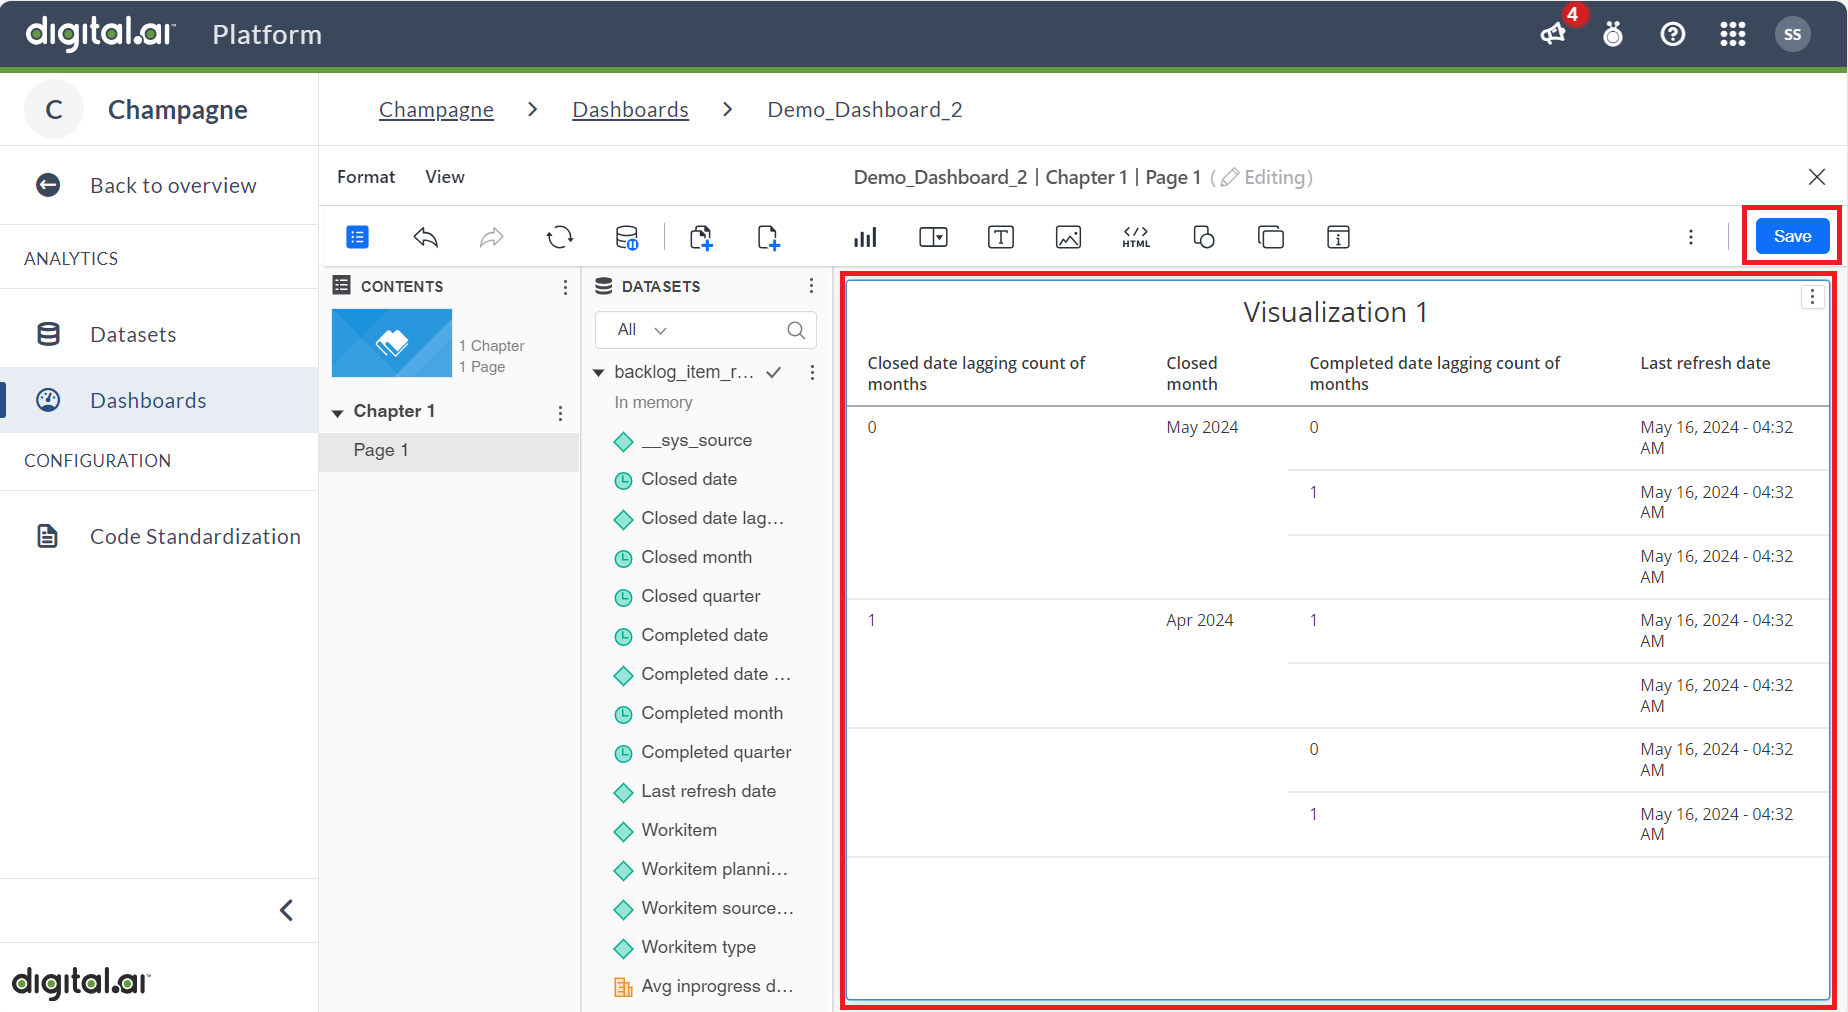
You can see the selected attributes appear on the Visualization screen. After confirming your choices click Save to create the dashboard.
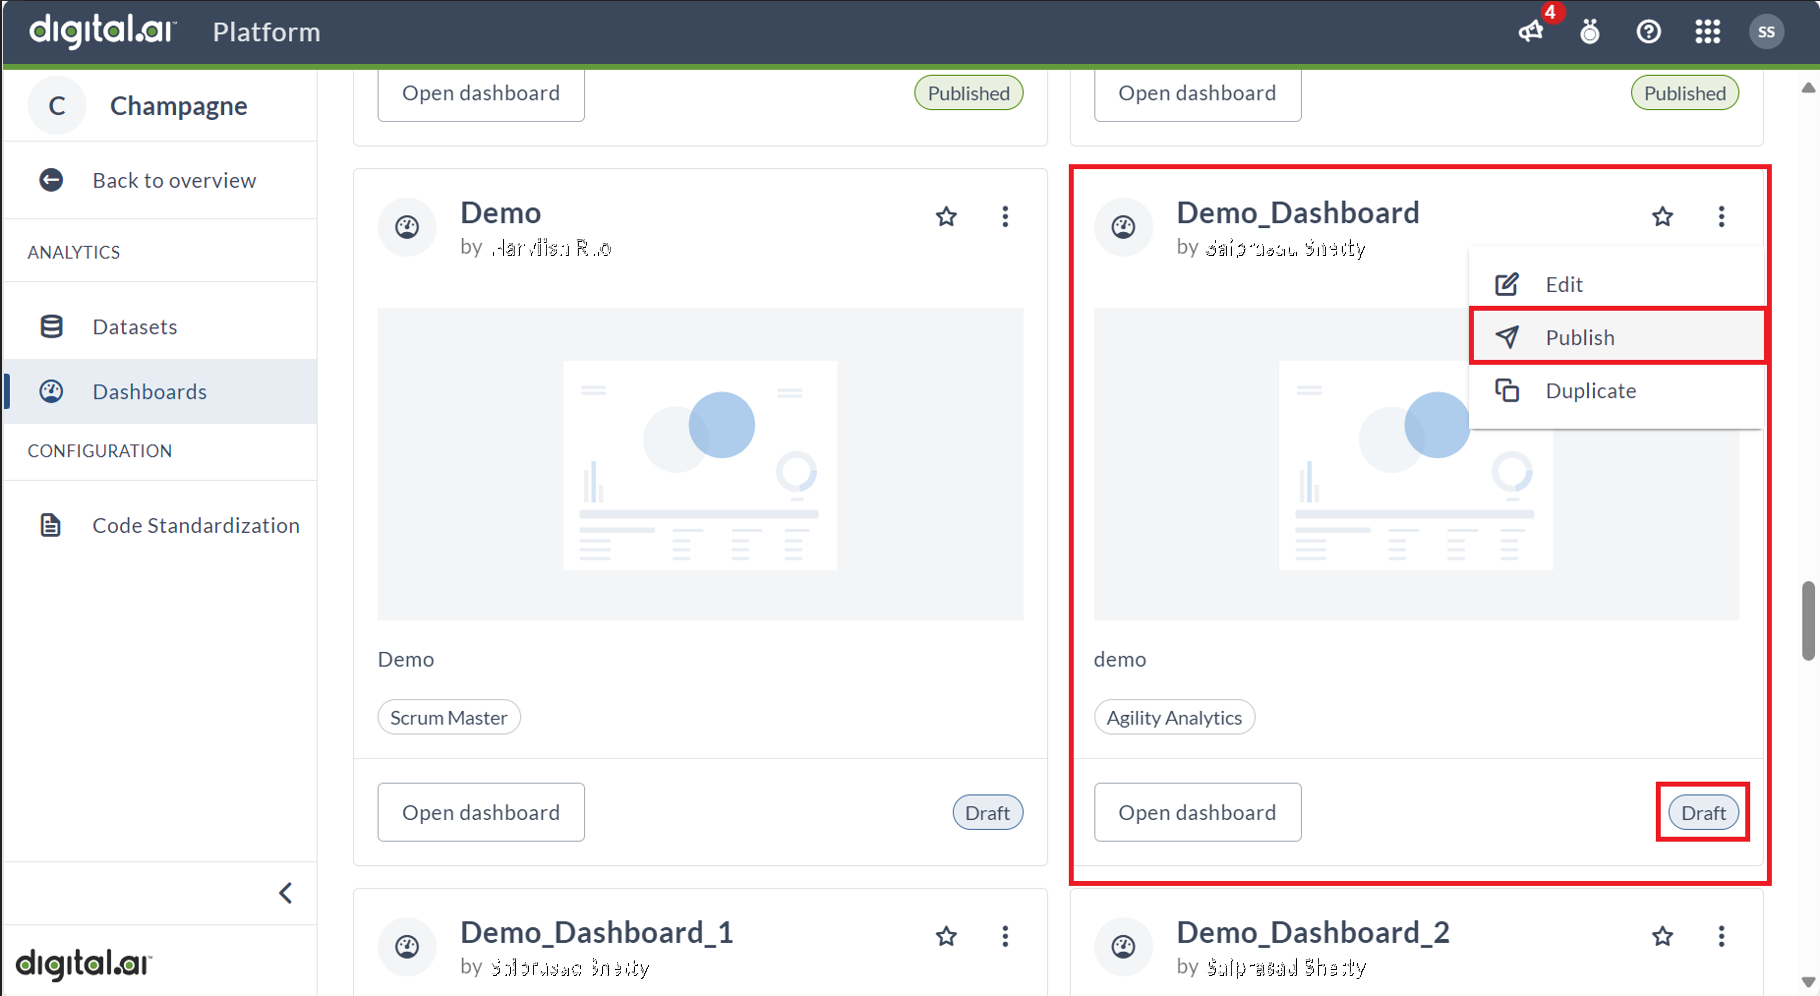
The created dashboard appears in the list of dashboards in the Draft state. Work-in-progress dashboards are saved as Draft, accessible only to users with the role of Author or above. Once the author determines that the Draft version is ready for end-user consumption, they must click Publish. Publishing the dashboard makes it available for regular users to view in both the platform and the source application.
For what happens after publishing, including editing a published dashboard and reverting changes, see Save, Publish, and Manage a Dashboard.
Add an Existing Dataset
You can add existing datasets from your environment to a dashboard.
- Create a blank dashboard or open an existing one.
- To add a dataset from your cloud environment or local machine, click View and select Datasets Panel to view the panel.
- Click More
 at the top of the datasets panel and choose Add Data > Existing Dataset. The Select Existing dataset dialog opens.
 - Select the required Source System and navigate to the dataset you want to add to your dashboard.
- Click Select. The new dataset appears in the Datasets panel.
Link Data in a Dashboard
When you are creating a dashboard, you can:
- Display data from multiple datasets in the same visualization.
- Use a visualization based on one dataset as a filter to update the data displayed in a visualization based on another dataset.
- Group data from one dataset based on an attribute that exists in another dataset.
To achieve any of these goals, you must link the attributes that are shared in common across multiple datasets.
Important: You have one dataset that contains Customer ID, Customer Name, and Profit data, and another dataset that contains Customer ID and Shipping Cost data. You can link the two Customer ID attributes, allowing you to display Customer Name, Profit, and Shipping Cost in one visualization, group Shipping Cost data by Customer Name, etc.
You can also manually link attributes when you are editing a dashboard. Manually linking attributes allows you to link attributes across multiple existing datasets. The attributes that you link to each other should uniquely identify each record, to ensure that the results are calculated accurately. In most cases, an ID attribute can be used to link attributes. The attributes that you link must be the same data type. You can link an attribute to attributes in one or more datasets.
An attribute that is linked across multiple datasets appears with a link icon  and appears as one attribute when added to a visualization.
You can choose to unlink attributes that are already linked, if the link is incorrect for your needs. Unlinked attributes with the same name are treated as two separate attributes when they appear in a visualization.
-
Open a dashboard that contains at least two datasets. You must have write access to the datasets you intend to link.
-
In the Datasets panel, right-click the attribute you want to link and choose Link To Other Dataset. The Link Attributes Dialog opens.
Note: Linked attributes appear with a Link icon
in the Datasets panel. -
In the first drop-down list, select the attribute to which you are linking the current attribute. You can type the name of an attribute in the field to narrow the list of choices.
-
Click Show Attribute Forms to define the attribute forms on which to base the link.
Note: At least one of the attribute forms that you link must be the ID attribute form.
-
Select the attribute form to link from the first drop-down list.
-
Select the attribute form to link to from the third drop-down list.
-
To link additional pairs of attributes, click Add a Link and repeat the steps to define a link for each pair.
-
To delete a link, hover over it and click Delete
 .
. -
Click OK. The attributes appear with a Link
icon in the Datasets panel.
Unlink Data in a Dashboard
-
Open the dashboard you want to modify.
Note: Linked attributes appear with a Link icon
in the Datasets panel. -
Right-click the attribute to unlink and select Unlink.
Next Step
Work with Visualizations — step 2 of the Build a Dashboard Workflow.