Video Report
Each test report includes an embedded video recording of the test execution. The video playback is synchronized with the active test step and the bottom log panel, allowing you to trace log output directly against visual execution. Video recordings are generated automatically upon regular test completion.
Test runs with an INCOMPLETE status may not include a video recording in the report.
The Video Report interface has been completely redesigned to improve usability and provide faster debugging:
- Side-by-side layout — Video player on the right, step details on the left
- Enhanced step filtering — Jump to failures, search steps, view timing details
- Improved navigation — Step counter (e.g., "Step 1 / 26") for quick positioning
- Synchronized playback — Video automatically advances with selected steps
- Rich context tabs — Device Log, Test Data, and Root Cause Analysis grouped below
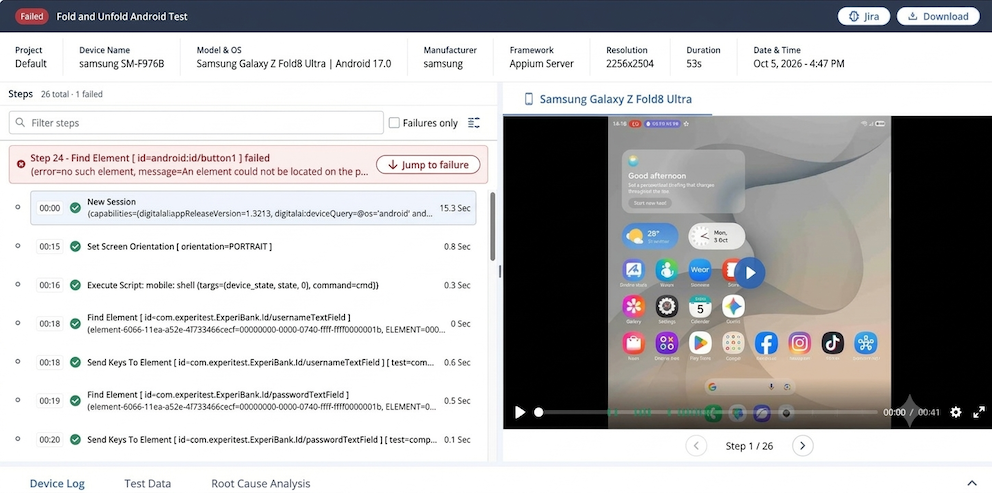
Test Steps
The steps panel on the left lists every step in the test. Each step shows its number, name, execution status, timestamp, and duration in seconds.
| Status | Symbol | Meaning |
|---|---|---|
| Passed | ✓ (green) | Step executed successfully |
| Failed | ✗ (red) | Step failed; execution halted here |
| Error | ⊗ (orange) | Step encountered an error |
Find a step
-
Search: Type part of a step name in the Filter steps box, such as "Find Element" or "Click." Click a result to move the video to that step.
-
Failures only: Select the checkbox to show only failed steps.
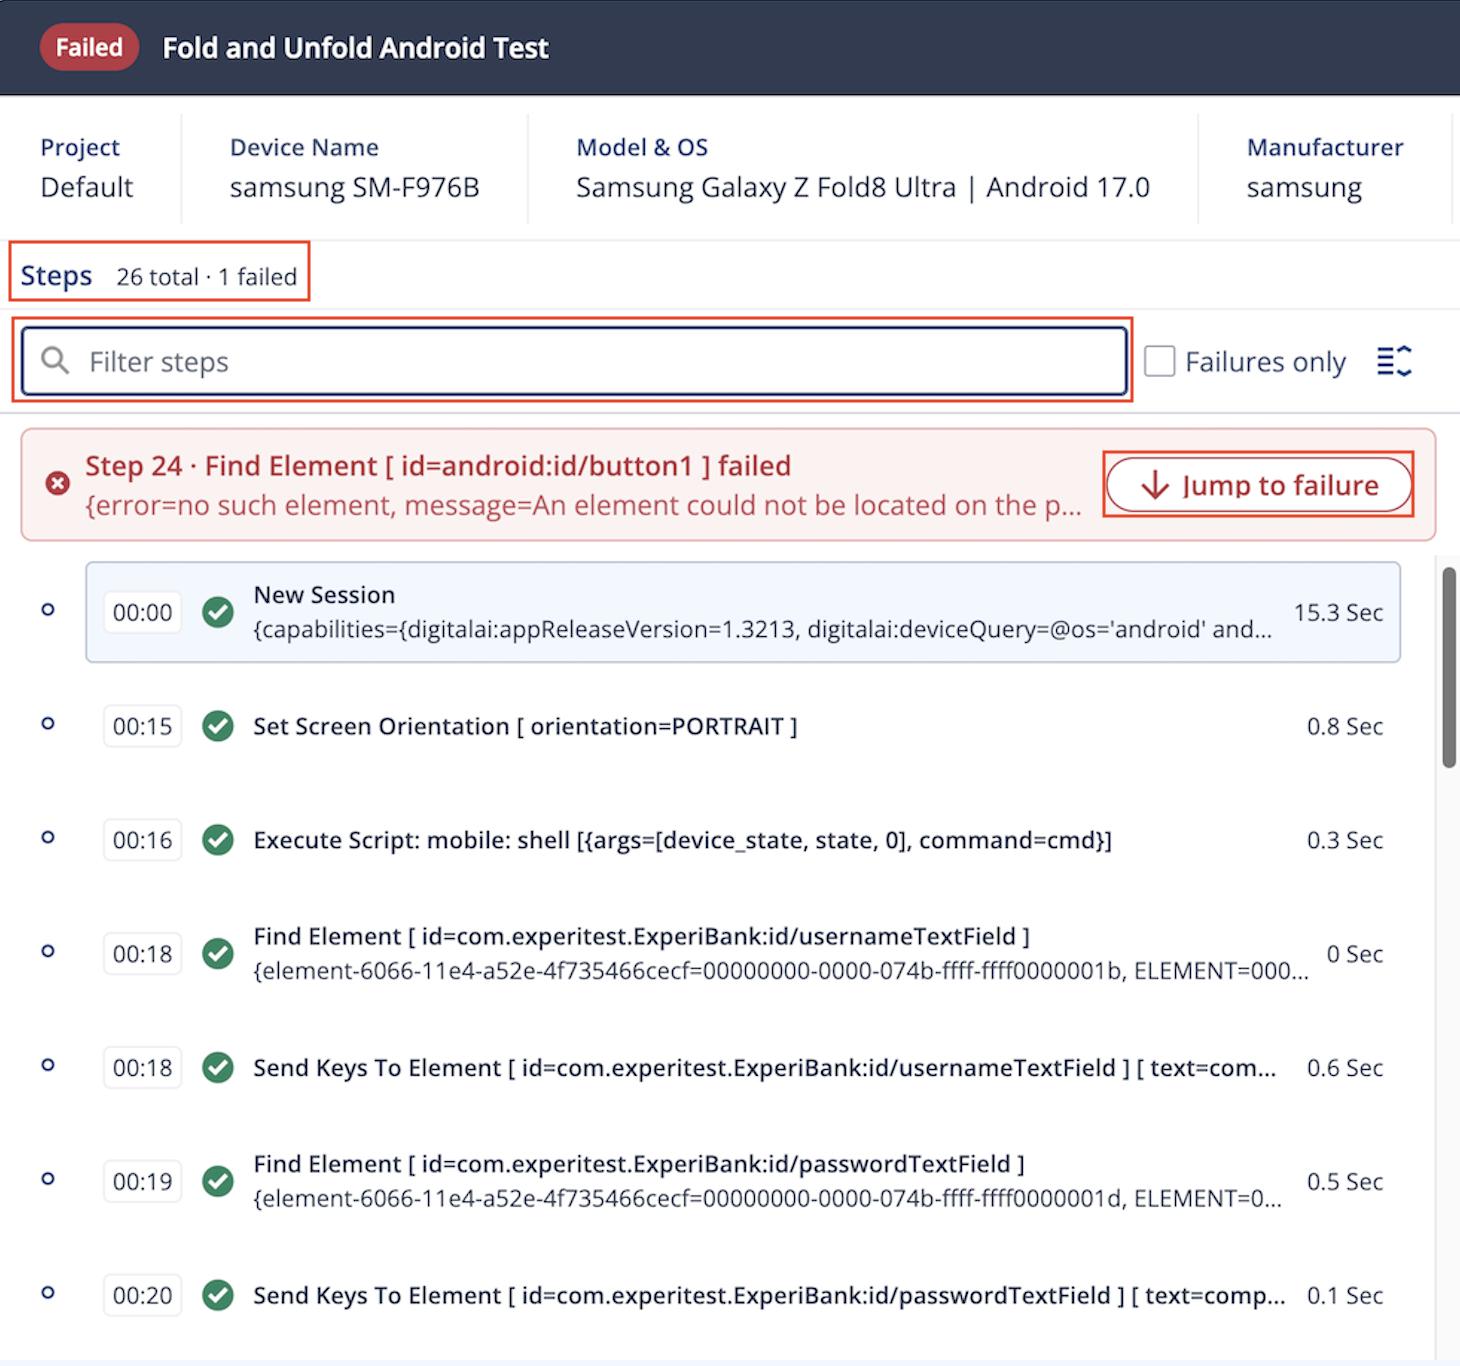
Jump to the failed step
When a test fails, a red banner appears above the step list. Select Jump to failure to move the video to the failed step.
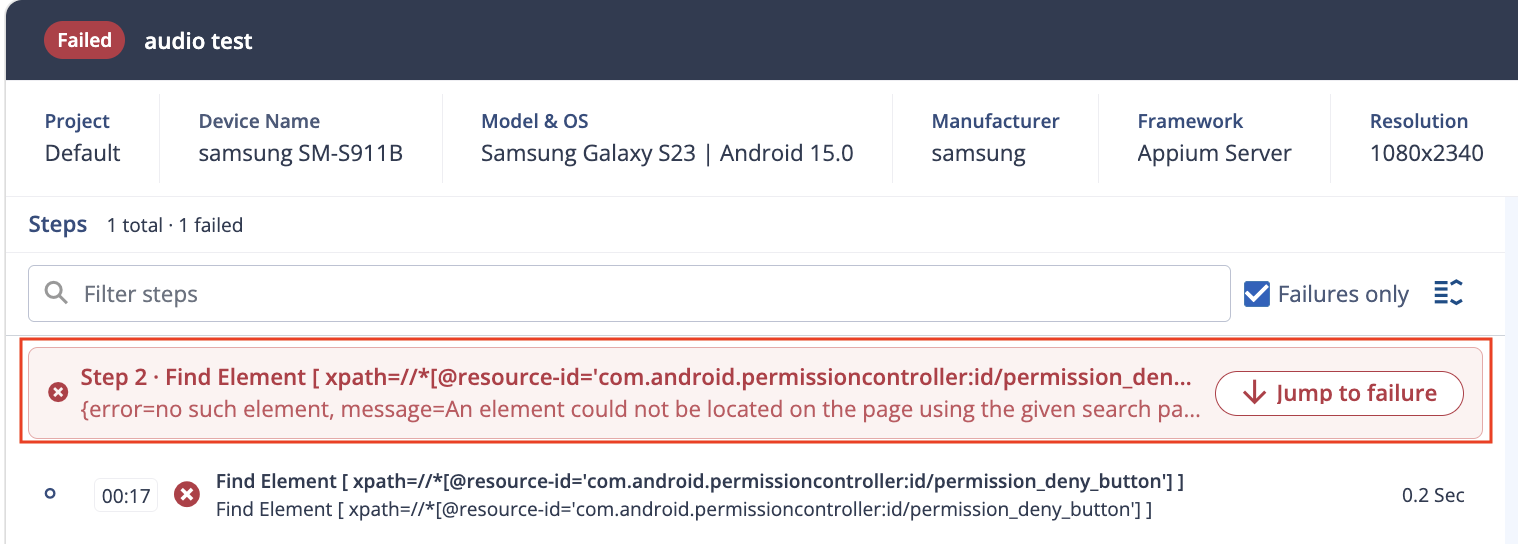
Move between steps
- Select a step to move the video to that point.
- Use the previous and next arrows below the video to move one step at a time. The counter shows your position, such as "Step 1 / 26."
Video Player
The video player includes these controls:
| Control | Function |
|---|---|
| Play/Pause | Start or stop video playback. |
| Timeline | Scrub to any point in the video; see the current time and total duration. |
| Speed | Adjust playback speed (0.5x, 1x, 1.5x, or 2x) for faster review. |
| Quality | Adjust video resolution (auto, 720p, 1080p, etc.). |
| Fullscreen | Expand the video to full screen for better visibility. |
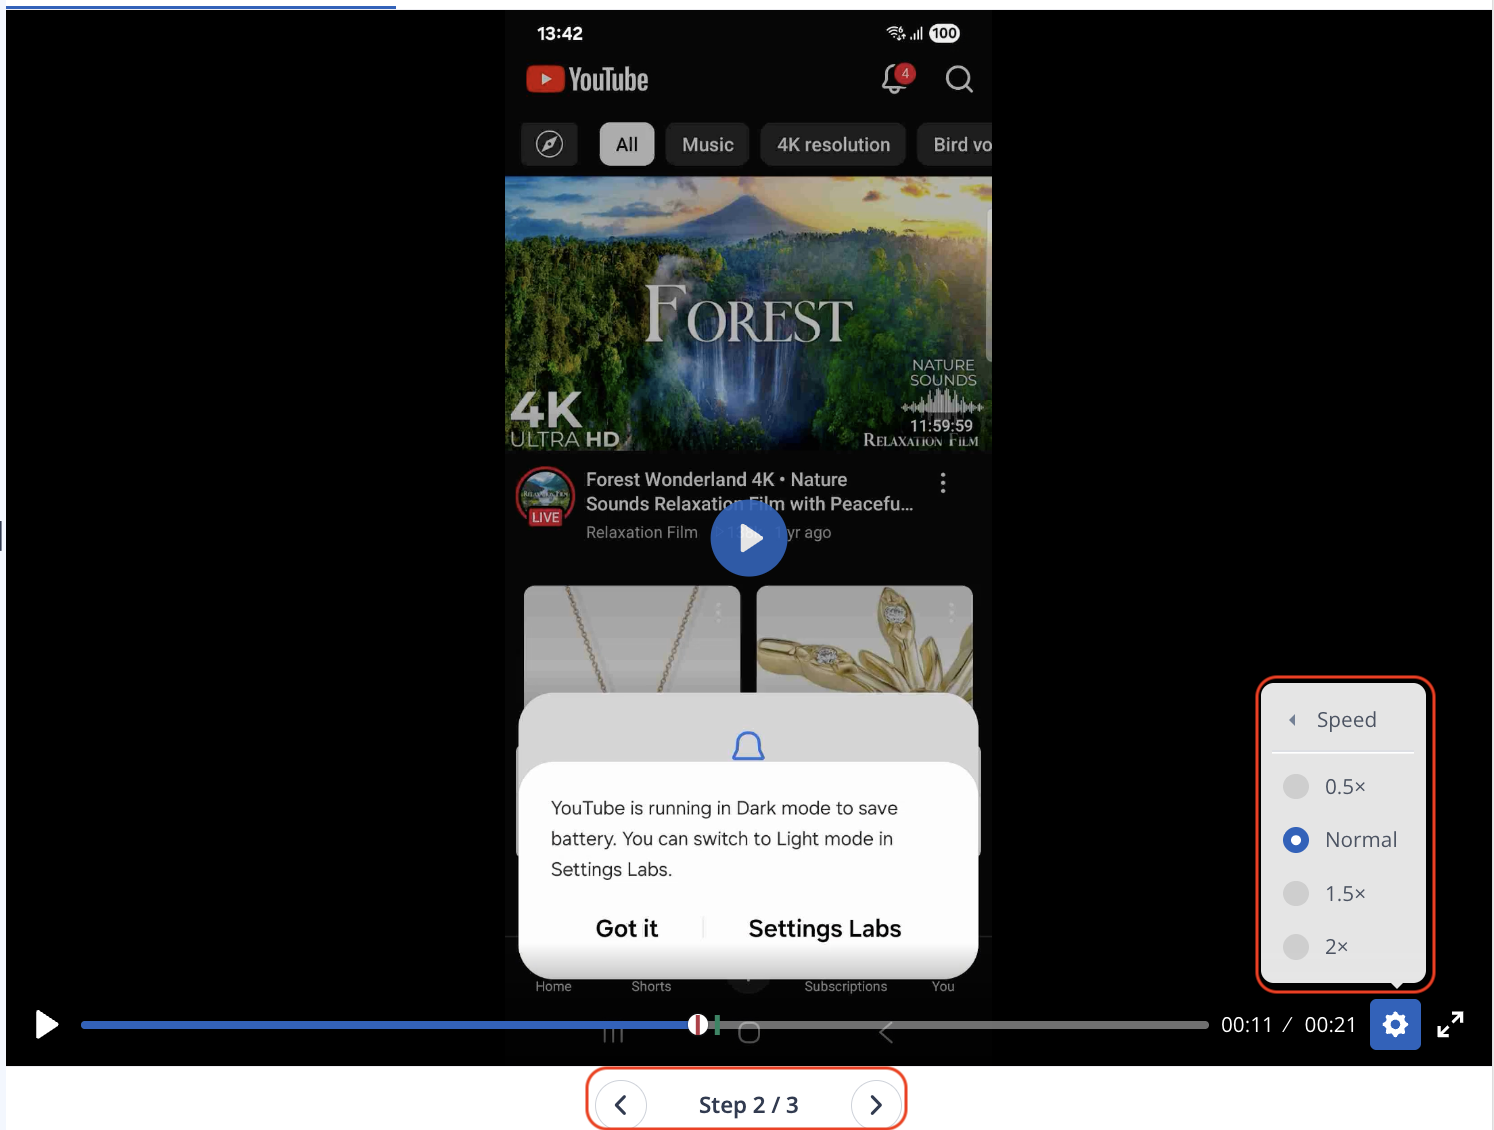
Bottom Panels
Three tabs appear below the video report.
- Device Log: System and application logs captured during the test. Use it to find crashes, exceptions, performance warnings, and system events.
- Test Data: Input data, assertions, and variables used during the test, including the values at each step.
- Root Cause Analysis: An automated analysis of the failure.
Object Spy
In a failed test report, the Object Spy tab appears on the device information line when Object Spy is available. Select the tab to open Object Spy.

(example object spy tab of a failed test)
Object Spy is used to inspect an application's elements at the time the driver.quit() command was executed. When Object Spy is available, a binoculars icon appears by the step.
The element tree is a representation of an XML file. Each element represents a node and its properties in the tree module.
The information presented in Object Spy is the application's state when a user performs the driver.quit() command.
Selecting Elements in the Object Spy
You can click on any element to select it. Clicking on an element will highlight it and show you its properties located in the XML tree. i.e:
Clicking on an image element or a tree element will:
- mark the element in the image
- change the selected element properties
- navigate the hierarchy tree to it.
Searching elements in Object Spy
You can select and isolate elements using the search bar on top of Object Spy. There are two types of search you can perform -
Search By Text
Select Text from the left drop down in search bar and type a text in the search text box to search for any element.

Search By XPath
Select 'XPath' from the left drop down in search bar and type a valid XPath expression in search text box. It will show you results and highlight the first element based on your search. You can also navigate to other search results by using the up/down arrow sign in right side of search bar.

If you wish to retrieve several XPath queries of the different properties of an element instead of manually querying for combination of XPaths, you can go with the option of "Add to Filter". Select the property for which you wish to obtain the XPath and click on the "Add to Filter" icon (shown in image below). Repeat the process for other properties if necessary.

Attachments
At the top right corner you'll find a 3 dots button. Clicking it shows the attachments menu of the report.
Menu content:
- External Report
- Downloads
- Create a Jira issue (below)
Clicking 'External report' will open the External Report in the browser for viewing.


Clicking 'Downloads' will open a popup that enables you to download each of the attachments (including the external report).
Following attachments are specific to the framework you are working on and are available to download (if they were generated):
Selenium
- Video
- External Report
Espresso
- Video
- Device log
- Trace
- Additional espresso specific log files if test fails
Appium
- Video
- Device log
- Container log
- Appium Server log
- WDA log
XCUITest
- Video
- Device log
- Process output
Grid (Seetest & Appium)
- Video
- Device log
- External Report
- Elements XML - Available for Appium. Generated on test failure. Represents the screen at the point of time driver.quit()
Additional attachments can be uploaded for each test by using the ManagerPublisher class (available for Java only).