Usage View
The Usage page provides Cloud Admins with insights into platform usage, including active test sessions, user activity, and peak usage periods. These insights help you monitor product adoption, platform utilization, and resource demand.
info
The Usage page is available only to Cloud Administrators.
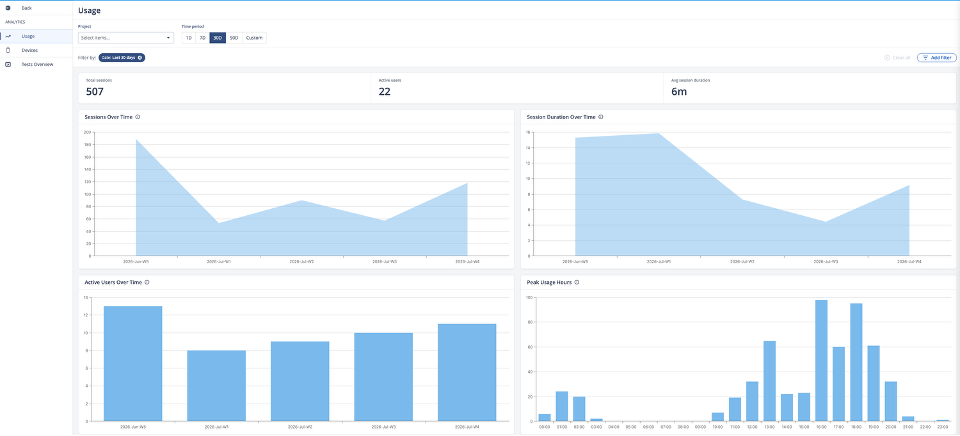
The Usage page displays, the KPI summary plus Sessions Over Time, Session Duration Over Time, Active Users Over Time, and Peak Usage Hours.
KPIs
| KPI | Description |
|---|---|
| Active Users | Total users who initiated at least one session in the selected scope. |
| Avg Session Duration | Average length of sessions in the selected scope. |
| Total Sessions | Total number of sessions in the selected scope. |
Charts
| Chart | Description |
|---|---|
| Active Users Over Time | Number of active users for each week, over time. |
| Peak Usage Hours | Total sessions by hour of day, showing when the platform is busiest. |
| Sessions Over Time | Total number of sessions per week, over time. |
| Session Duration Over Time | Total hours of completed sessions per week, over time. |
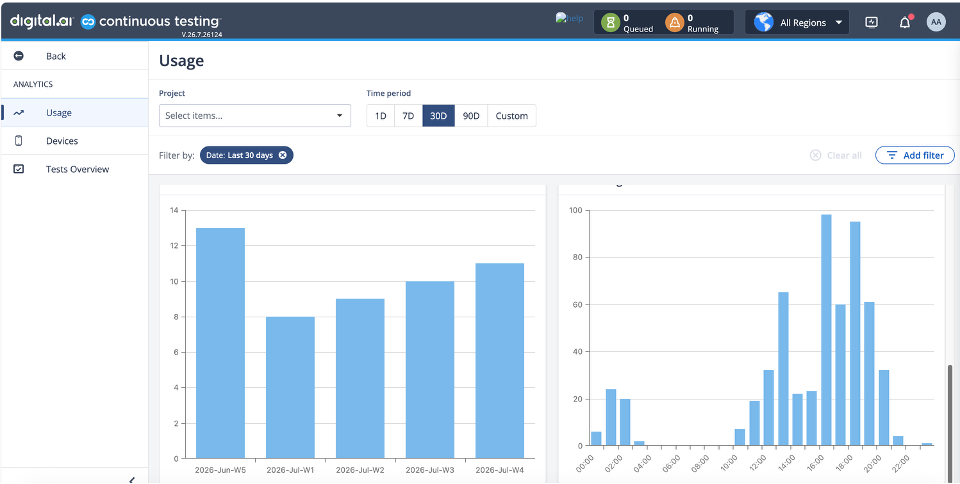
Active Users Over Time and Peak Usage Hours, showing usage concentrated in the afternoon and early evening.
info
Hover over any bar or point on a chart to see its exact value.