Tests Overview
The Tests Overview page provides a consolidated view of test execution activity, including execution trends, pass and fail rates, and overall test distribution. You can also drill down into individual test runs to investigate failures and analyze execution details.
The Tests Overview page is available to Cloud Administrators, Project Admins, and Users. Each user can view data only for the projects they are allocated to.
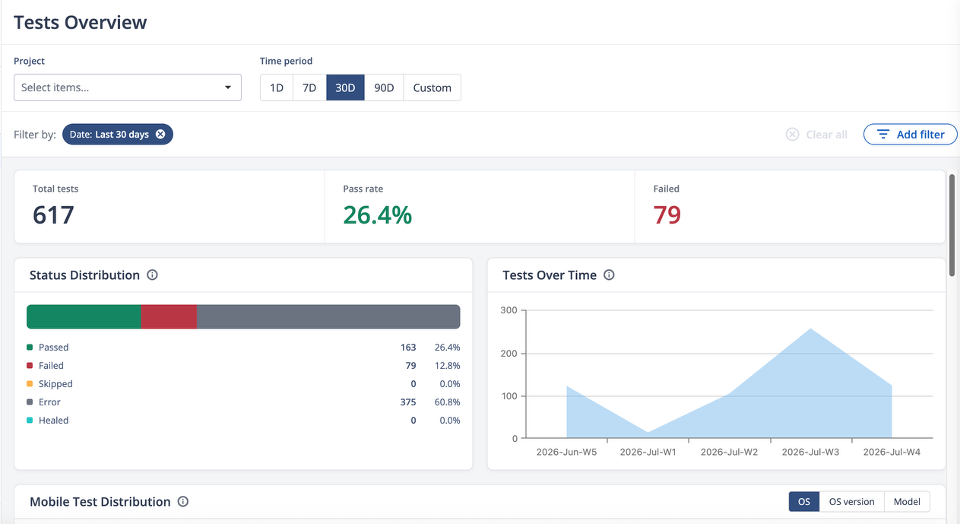
The above image displays the KPI summary, Status Distribution, Tests Over Time, and the start of Mobile Test Distribution (toggle by OS, OS version, or Model).
KPIs
| KPI | Description |
|---|---|
| Failed | Total executions with a Failed status. |
| Pass Rate | Percentage of executions with a Passed status. |
| Total Tests | Total executions in the selected period. |
Charts
| Chart | Description |
|---|---|
| Mobile Test Distribution | Coverage broken down by OS, OS version, or Model, with a details table of runs and pass, fail, error, and skip counts per category. |
| Status Distribution | Share of executions that are Passed, Failed, Skipped, Error, or Healed. |
| Tests Over Time | Test execution volume per week, over time. |
Switch the Mobile Test Distribution grouping
- Locate Mobile Test Distribution.
- Click OS, OS version, or Model in the toggle at the top-right of the chart.
Result: The donut chart and coverage details table update to group results by the selected dimension.
All Tests
Scroll down for a paginated table of individual test executions, sorted by Start Time, most recent first.
| Column | Description |
|---|---|
| Cause | The underlying cause category, where available. |
| Duration | How long the execution ran. |
| ID | Unique identifier for the execution. |
| Start Time | When the execution started. |
| Status | Passed, Failed, Error, Skipped, or Healed. |
| Test Name | Name of the test. Click it to open the execution video report. |
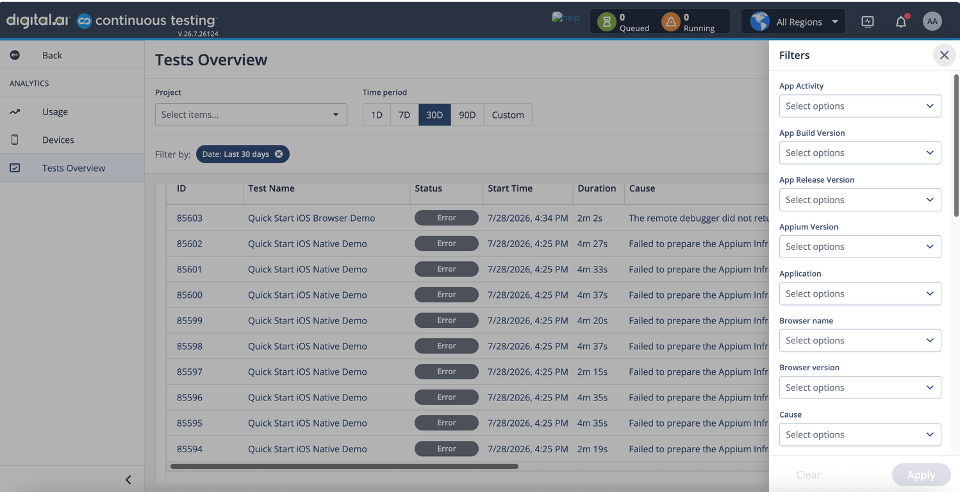
::: The above image displays the execution table alongside the Add Filter drawer — a partial view of the available filters. :::
Open a test execution's video report
- Locate the execution in the table.
- Click its Test Name.
Result: The video report opens in a new browser tab. For how to read the report.
Sort and page through the execution table
- Click a column header to sort by that column. Click again to reverse the order.
- Use the page size control to show 10, 25, or 50 rows per page. The default is 25.
- Use the pager at the bottom of the table to move between pages.