Group By
Use Group by to break down the metrics on an Analytics page by one property, such as OS, platform, project, or test framework. This shows how your results are distributed and lets you compare segments side by side.
Group by is available on these pages:
Group the page by a property
- Open the Usage or Tests Overview page.
- Click Group by. The default value is None.
- Search for a property and select it.
- To remove the grouping, clear the selection.
Result: Grouping applies right away, and the selector shows Grouped by:
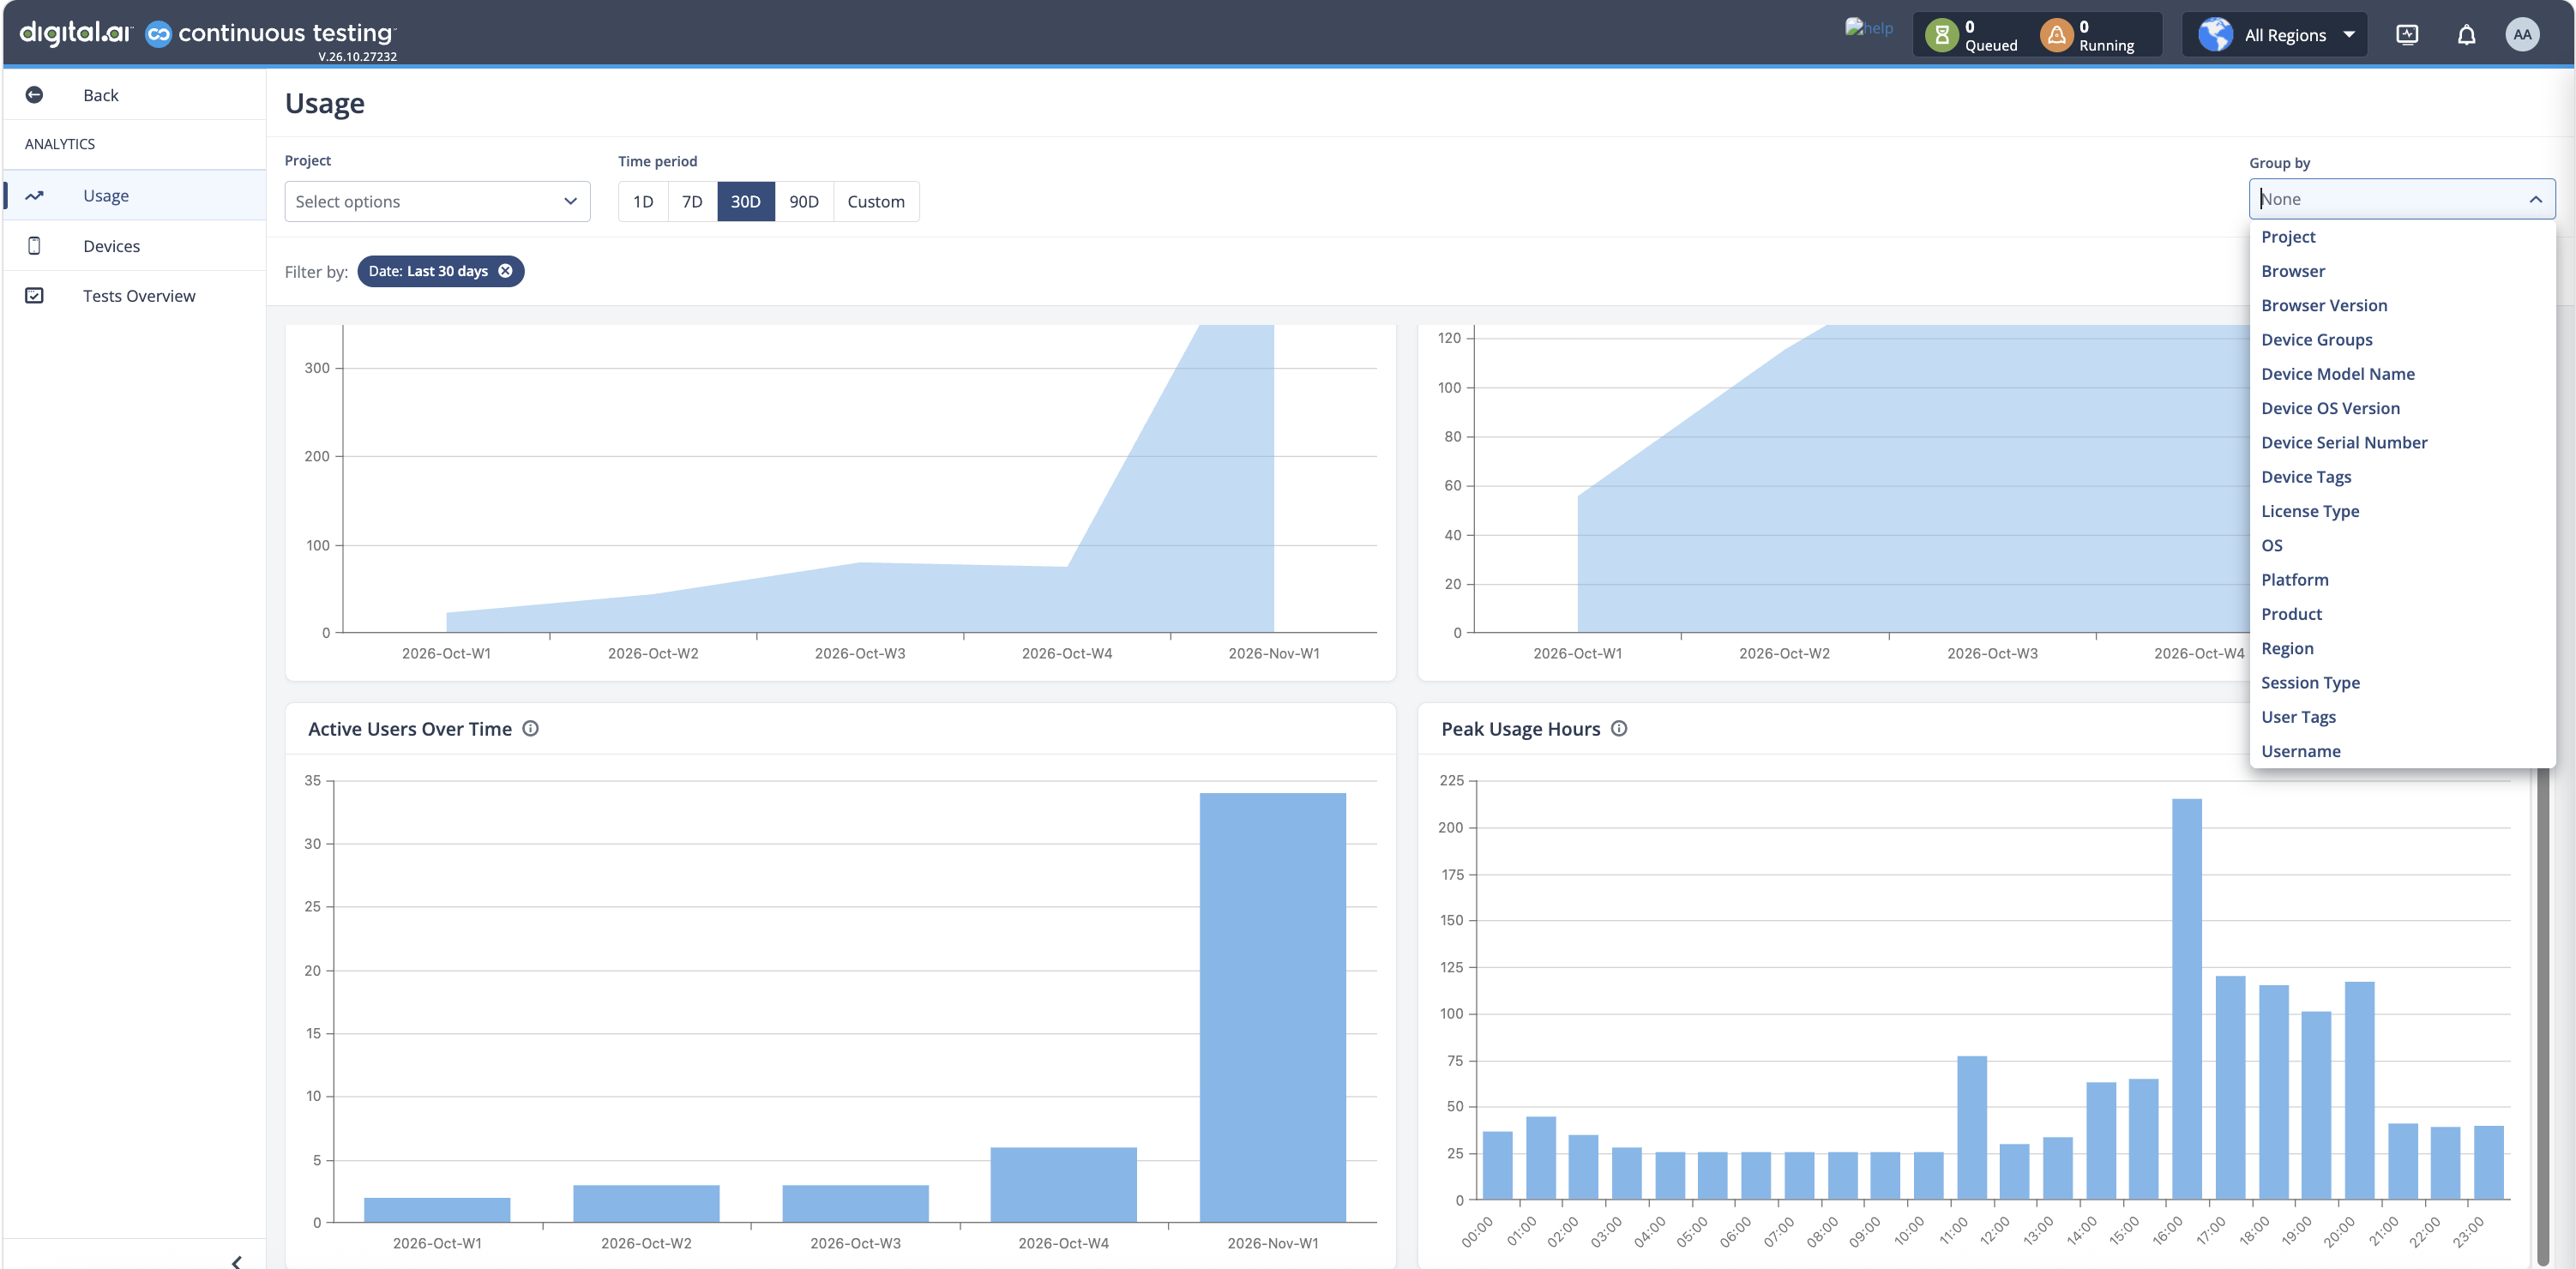
What changes when you group
| Page element | Behavior when grouped |
|---|---|
| Charts | Show the top 5 values by metric, plus Other for all remaining values. |
| Test Distribution | Controlled by the page-level Group by, which replaces its earlier local toggle. Shows the top 5 values plus Other. |
| All Tests table | Shows every group, with no top-N limit and no Other group. Groups and rows are paged. |
| KPI and big-number cards | Never grouped. |
| Status Distribution | Stays aggregated when you group by status. |
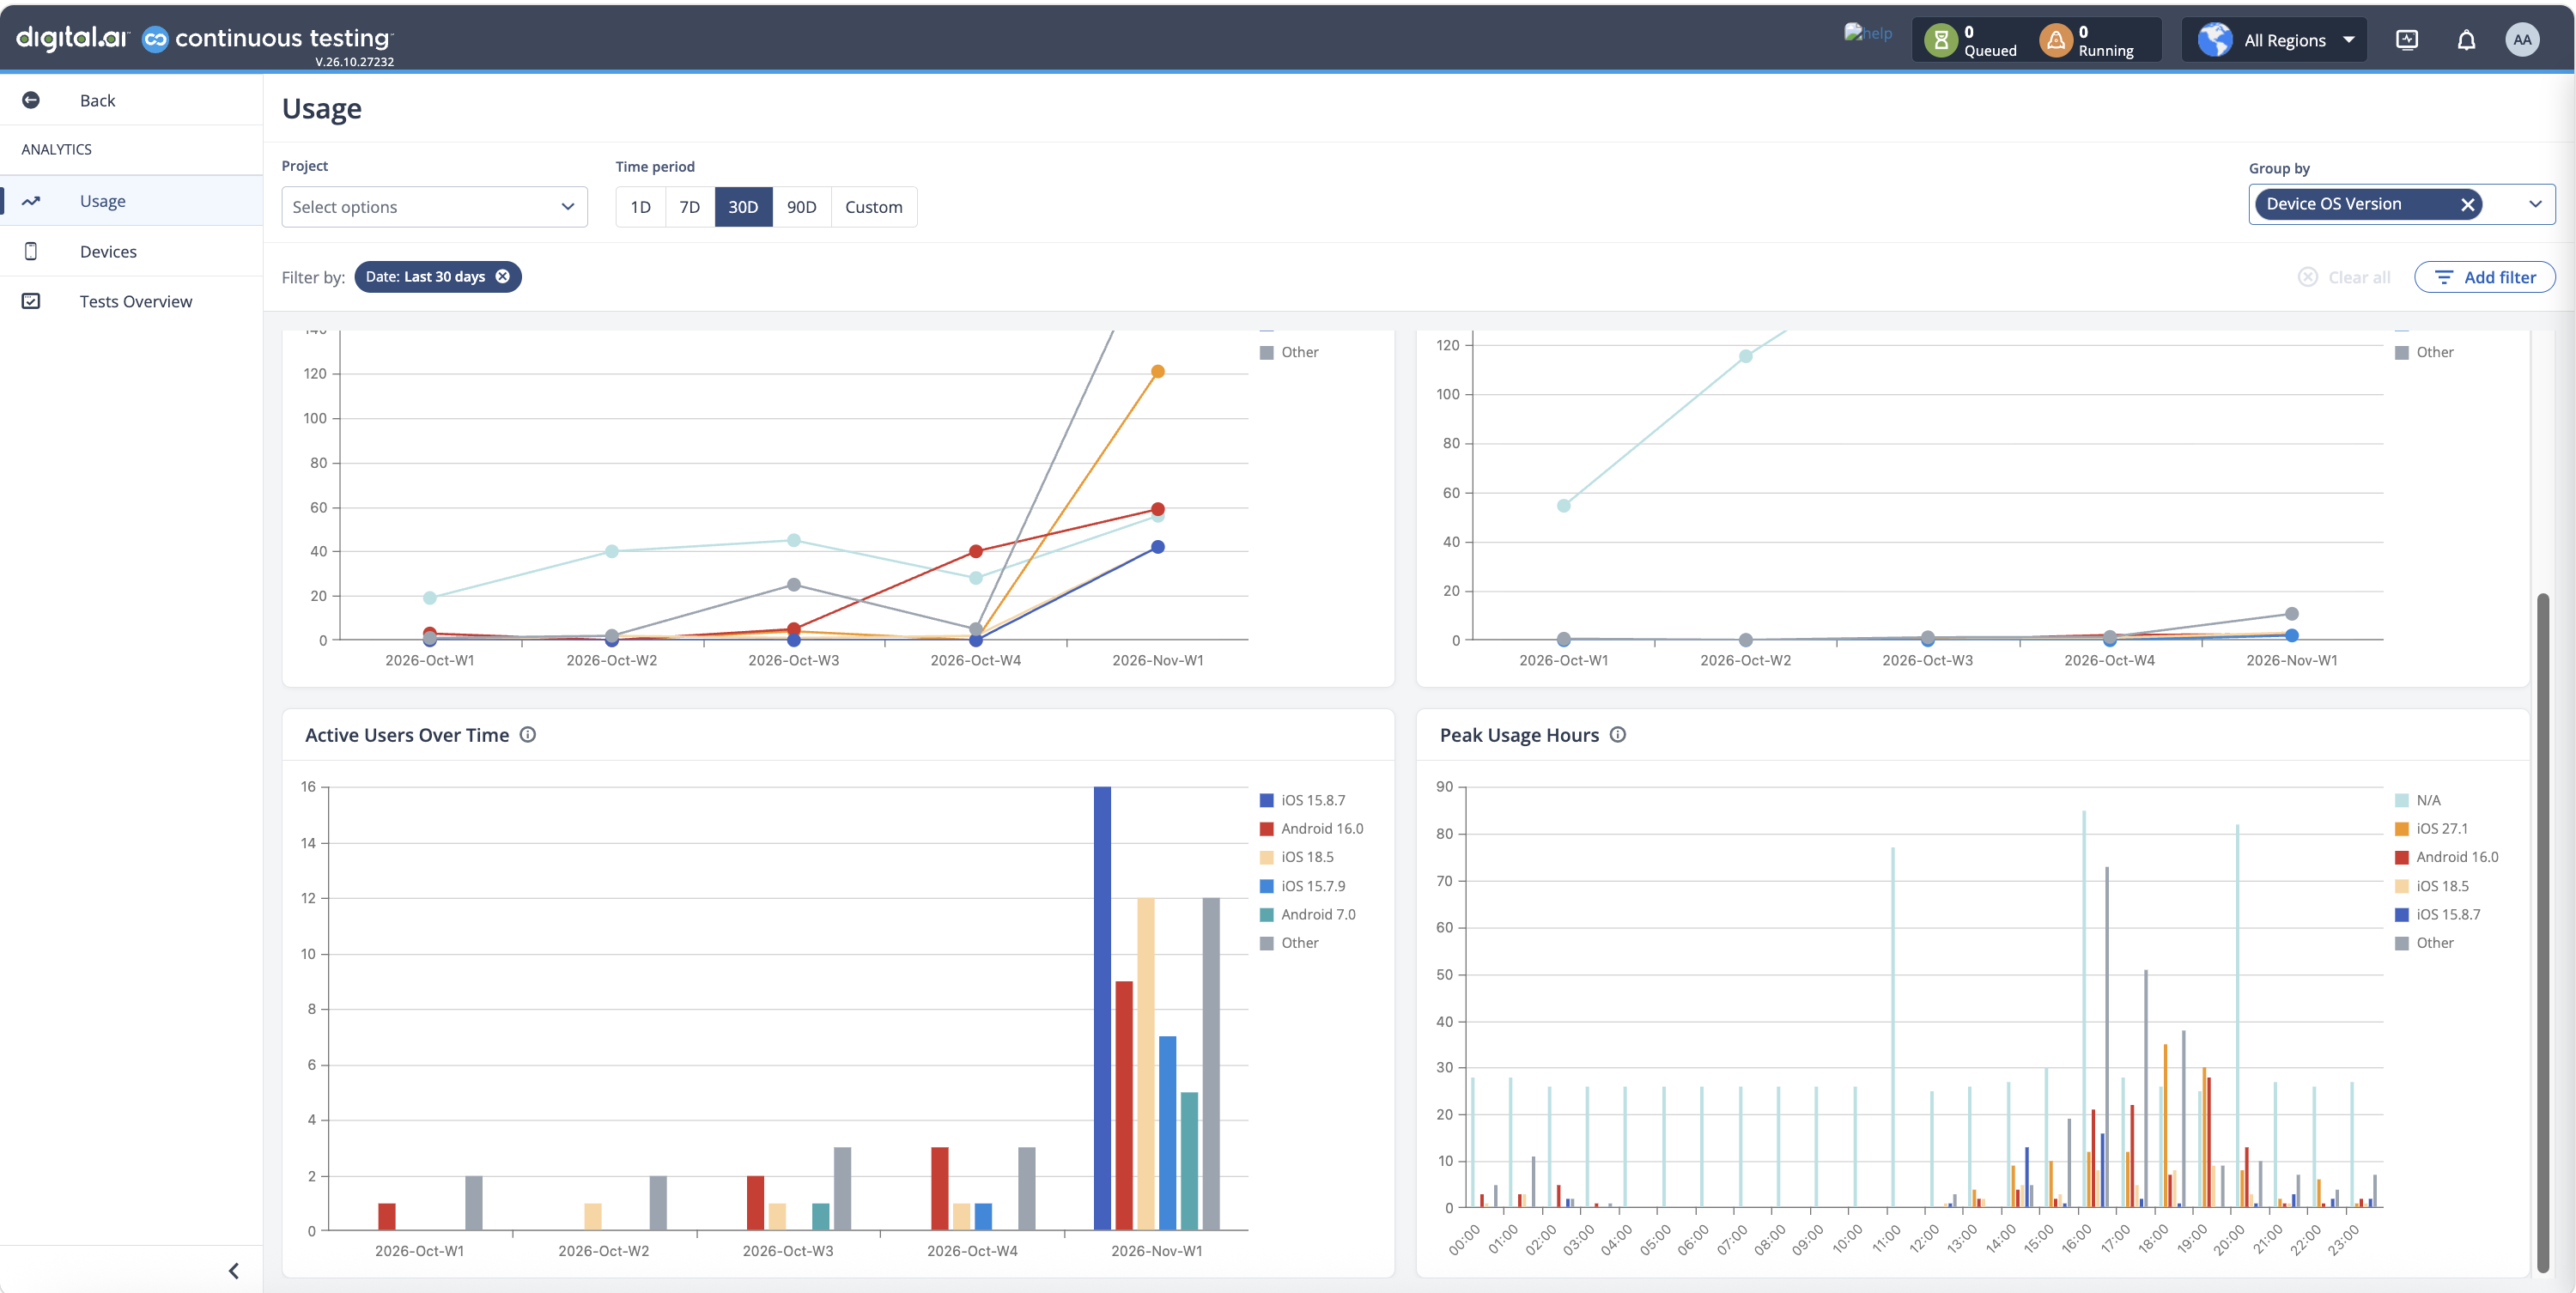
Group by with filters
Group by and filters work independently, so clearing one does not change the other. If you filter on the same property you grouped by, the filter controls which values appear:
- 10 or fewer values remain: all values are shown.
- More than 10 values remain: the top 10 values are shown, plus Other.
tip
To keep charts clear and easy to read, we recommend filtering to 10 or fewer values.