Getting Started with Analytics
All Advanced Analytics views share a consistent layout and navigation. Once you are familiar with one view, you can navigate and use the others.
Prerequisites
- Your organization has an active Premium Digital.ai Testing Cloud plan.
- You have valid sign-in credentials for Digital.ai Testing Cloud.
- Your account has the role required for the view you want to open.
Open an Analytics view
- Sign in to Digital.ai Testing Cloud.
- In the left navigation, locate ANALYTICS, below the main menu.
- Select Usage, Devices, or Tests Overview.
Result: The selected view opens, showing data for all projects you have access to over the last 30 days by default.
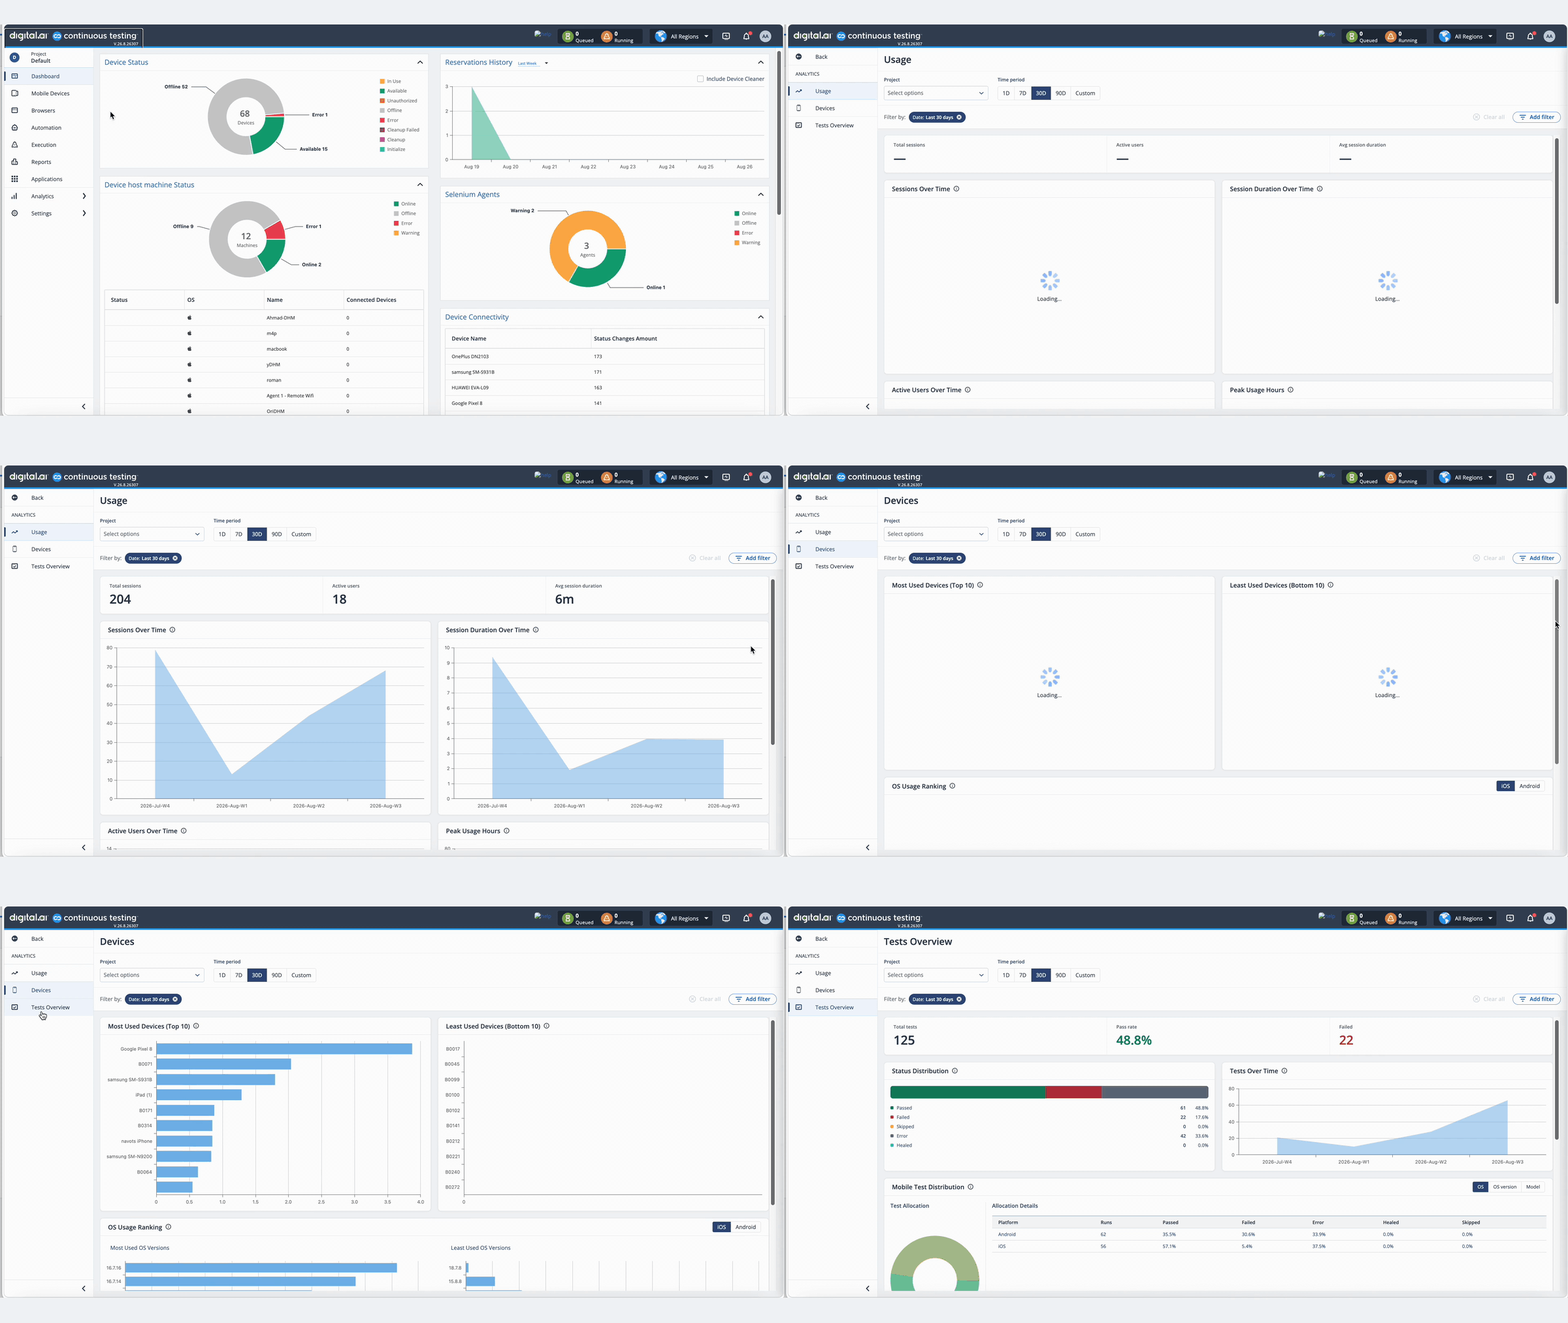
Page layout
| Element | Description |
|---|---|
| KPI cards | Headline numbers for the current filter scope, such as Total Sessions or Total Tests. |
| Filter bar | Project and Time Period controls, plus active filter chips and the Add Filter button. For more information, see Filtering |
| Charts | Trend lines, bar charts, and distributions that visualize the KPIs over time or by category. |
| Tables | Row-level detail, available on the Tests Overview page, with sorting and pagination. |
info
Hover over any bar or point on a chart to see its exact value.
Next steps
- Getting Started — prerequisites, opening a view, and reading the page layout
- Filtering — every filter across all three views
- Usage - platform adoption and engagement — sessions, active users, session duration, and peak usage hours
- Devices - device fleet utilization and OS version coverage across your testing environment
- Tests Overview - test execution health, trends, coverage, and per-execution drill-down
- Tips and Troubleshooting - common issues and solutions for Advanced Analytics