Build Custom Reports
This tutorial guides you through creating custom reports in Digital.ai Agility Analytics using the Report Builder interface.
Prerequisites
Before building custom reports, ensure:
- You have access to Digital.ai Agility Analytics
- The Data Mart database is configured and updated with your project data
- You understand your reporting requirements and data sources
Access the Report Builder
The Report Builder provides a comprehensive interface for creating full-featured reports.
The Report Builder is designed specifically for reports. To build or modify dashboards, use the Dashboard Builder instead.
To access the Report Builder:
- Hover over the Add button in Analytics
- Select Report from the dropdown list
The template selection dialog appears with six pre-built templates plus a Blank template option.
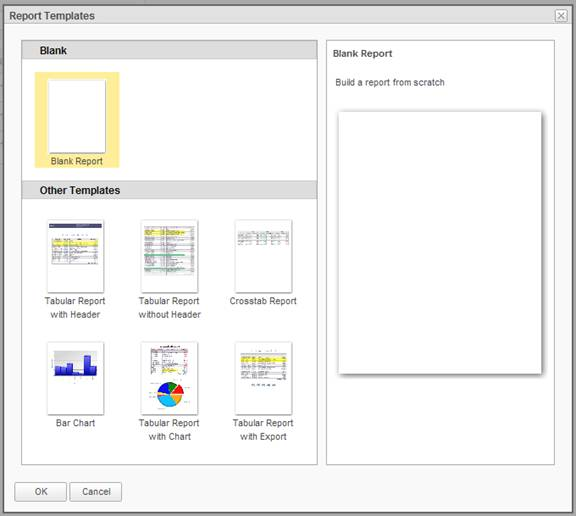
- Choose a template or select Blank to start from scratch
- Click OK to proceed
Understand the Report Builder Interface
The Report Builder interface consists of several key components:
Breadcrumb Trail
At the top of the page, a breadcrumb trail shows your navigation path through recently visited pages and folders.
![]()
Function Ribbon Tabs
Below the breadcrumb trail, three tabbed ribbons provide core functionality:
File Tab
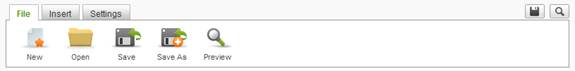
The File options manage report definitions:
- Create new reports
- Open existing reports
- Save report definitions
- Save with a new name
- Preview the current report
Insert Tab
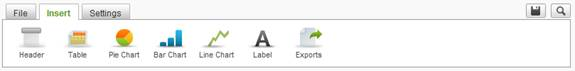
The Insert options add display elements to your report:
- Tables and crosstabs
- Charts and graphs
- Labels and images
- Headers and footers
Display elements can be added by clicking or using drag-and-drop to the Report Layout panel.
Settings Tab
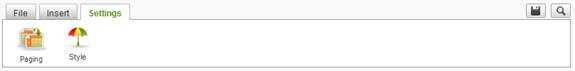
The Settings options control report appearance:
- Page layout and size
- Paging options
- Stylesheet selection
Side Panels
Report Layout Panel
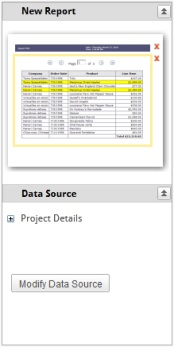
The Report Layout panel displays thumbnails of display elements in sequence. You can:
- Remove elements by clicking the red
 icon
icon - Rearrange elements using drag-and-drop
- Open element configuration by clicking the thumbnail
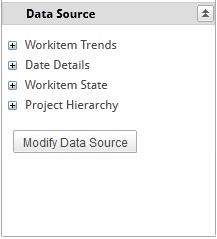
Data Source Panel
The Data Source panel lists:
- Selected data objects
- Calculated columns
- Statistical columns
Click Modify Data Source to adjust your data selections.
Configuration Panel
The center Configuration panel provides tabs for configuring display elements. Each element has at least one configuration tab.
![]()
Use the Previous Step and Next Step buttons to navigate between configuration tabs.
Save your work frequently to avoid losing changes due to session timeout.
Select Data Sources
Selecting the appropriate data source is the foundation of effective custom reporting.
Access Data Source Selection
After selecting a template, the Select or Modify Data Source dialog appears automatically. You can also access it anytime by clicking Modify Data Source in the Data Source panel.
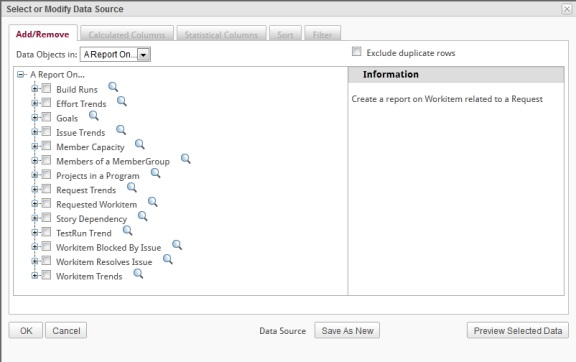
Understand Data Object Categories
If data objects are categorized, use the Data Objects dropdown filter to narrow the list:
- All: Shows all available data objects
- A Report On: Trending and historical data objects
- Detail Data Objects: Current attribute values from the latest ETL load
- Quick Reports: Predefined queries for common reporting needs
- Value Data Objects: Drop-down list values from Agility
Select Data Objects
To select data objects for your report:
- From the Data Objects dropdown, choose a category or select (All)
- Click the checkbox next to each data object you want to include
- As you select objects, the tree refreshes to show related objects
- Expand data objects to view their available columns
- Click the
 icon next to an object to view sample data
 - Review the Information panel for descriptions of data objects and columns
The Exclude duplicate rows checkbox ensures only distinct rows are returned (rows with identical values for all selected columns are excluded).
To save your data source selection:
- Click OK to save selected items
- The Data Source panel updates to reflect your selections
Most reports use a single data source shared by all display elements.
If you select only one data object, column references appear as Column Name. With multiple data objects, references use Data Object.Column Name notation.
Key Data Source Objects
Review the complete list of available data sources in Data Source Objects. Key objects include:
Trend Data (A Report On category):
- Effort Trends - Time spent working on features and defects
- Workitem Trends - Daily changes to workitems with semi-additive columns
- Epic Trends - Epic data over time
- Issue Trends - Daily changes to issues
Detail Data (Detail Data Objects category):
- Workitem Details - Current workitem attributes (Dim.PrimaryWorkitem)
- Project Details - Current project attributes (Dim.MyProject)
- Epic Details - Current epic attributes (Dim.EpicView)
- Member Details - Team member information (Dim.Member)
Quick Reports:
- Workitem Trend Report - Predefined query for workitem trends
- Member Effort Report - Effort by team member
- Blocked Workitem Report - Workitems and blocking issues
Filter and Sort Data
Filtering focuses your report on specific data, while sorting controls the order of results.
Set Report Filters
Filters restrict the data included in your report using criteria you define.
To create a filter:
- Click Modify Data Source to open the dialog
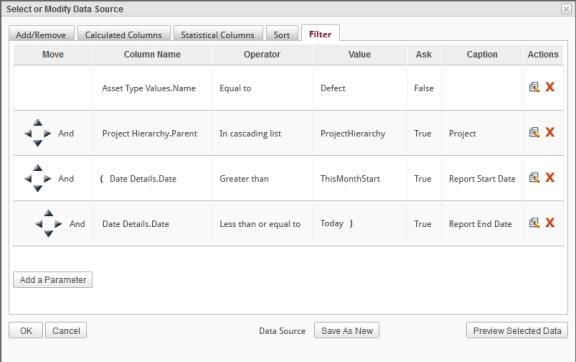
- Select the Filter tab
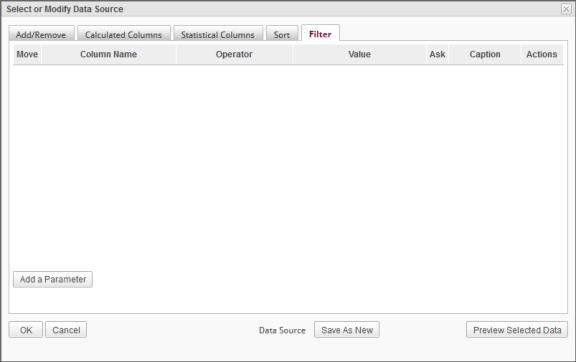
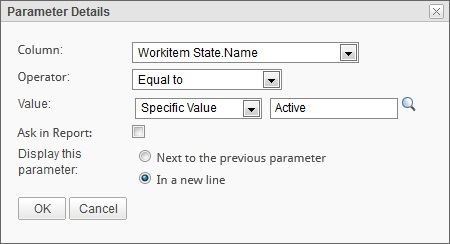
- Click Add a Parameter to open the Parameter Details dialog
-
Select a Column from the dropdown
-
Choose a comparison Operator:
- Equal to / Not equal to
- Less than / Greater than
- Less than or equal to / Greater than or equal to
- Starts with / Does not start with (text only)
- Ends with / Does not end with (text only)
- Contains / Does not contain (text only)
- Is null / Is not null
- Between / Not between
- In list / Not in list
- In cascading list
-
Select a Value type:
- Specific Value: Enter a threshold value or click to select from database values
- Pre-defined Date: For date columns, use tokens like Today, This Year End, Last Fiscal Quarter Start
- Specific Value: Enter a threshold value or click
-
Enter the Value threshold
-
Click OK to add the parameter
Use the ![]() icon to view valid values from the database and populate the Value field automatically.
icon to view valid values from the database and populate the Value field automatically.
Create Ask Parameters
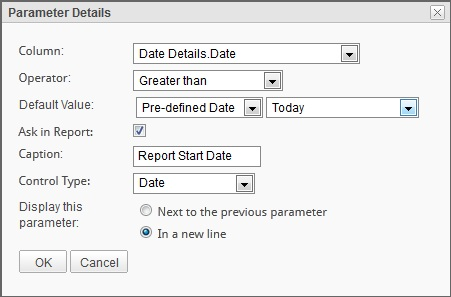
Ask parameters allow report viewers to modify filter values when running the report.
To create an ask parameter:
- In the Parameter Details dialog, enable Ask in Report
-
Enter a Parameter Caption (auto-generated if left blank)
-
Select a Control Type based on the operator and column data type:
- Text / Text (multi line)
- Dropdown
- List (single select / multi select)
- Date picker
- Checkbox
-
Choose Display this parameter:
- Next to previous - Shows parameter inline
- On new line - Shows parameter on its own line
-
Click OK to save the ask parameter
When the report runs, users can modify these values before rendering.
Combine Multiple Filters
When you add multiple parameters, combine them using logical operators:
To combine filters:
-
Add your first parameter as described above
-
When adding the next parameter, choose the logical operator:
- And - Both conditions must be true
- Or - Either condition can be true
-
Use the directional pad
 to create levels and control evaluation order
Sort Report Data
Sorting determines the initial order of data when the report runs.
To sort report data:
- In the Select or Modify Data Source dialog, select the Sort tab
- Choose columns to sort by
- Select sort direction (ascending or descending)
- Specify sort priority for multiple columns
- Click OK to save
Create Calculated Columns
Calculated columns create new columns based on formulas applied to existing column data.
Access Calculated Columns
To create a calculated column:
- Click Modify Data Source
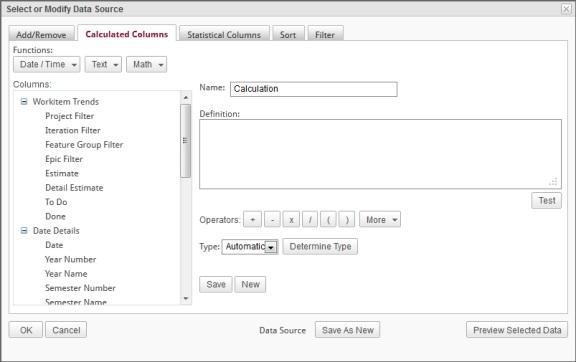
- Select the Calculated Columns tab
Build Column Definitions
Create formulas using:
- Data source columns: Click columns in the tree to insert references
- Operators: +, -, *, /, %
- Functions: Predefined date, text, and numeric functions
- Constants: Literal values
Available function categories:
- Date functions: Date manipulation and formatting
- Text functions: String operations (CONCAT, SUBSTRING, UPPER, LOWER)
- Numeric functions: Mathematical calculations (SUM, AVG, ABS, ROUND)
To define a calculated column:
- Enter or build the formula in the Definition textbox
- Use the function buttons to insert common functions
- Click columns in the tree to add column references
- Click operator buttons to add +, -, *, / symbols
- Click Test to verify syntax against the database
- Select the Type (or use Auto for automatic detection)
- Click Determine Type to auto-detect from formula
- Enter a Name for the calculated column
- Click Save to store the column definition
The column appears in the data objects tree and becomes available for use in display elements.
Use the Preview Selected Data button to see all columns including calculated columns before saving.
Calculated columns must be used in the report to be saved in the definition. Unused calculated columns are automatically removed.
Create Statistical Columns
Statistical columns perform analytical calculations on existing column data.
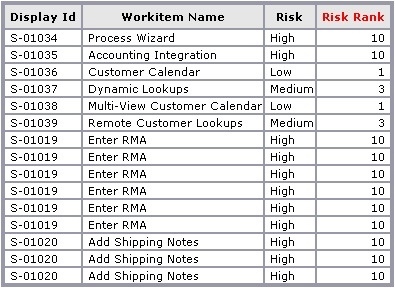
Available Statistical Functions
- Rank - Ranks data from lowest to highest value
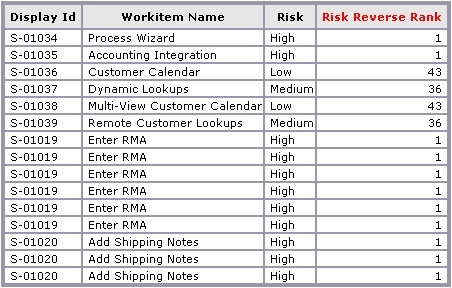
- Reverse Rank - Ranks data from highest to lowest value
- Percentile - Classifies data by percentage distribution
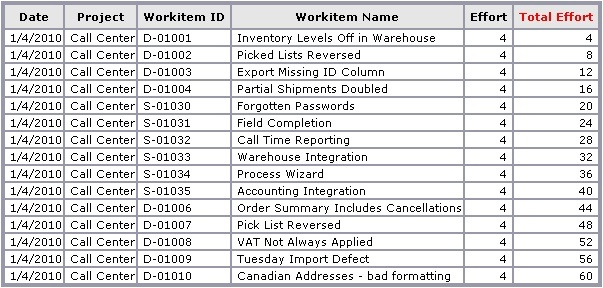
- Running Total - Maintains cumulative total
- Difference from Previous - Shows change from previous row value
Create a Statistical Column
To add a statistical column:
- Click Modify Data Source
- Select the Statistical Columns tab
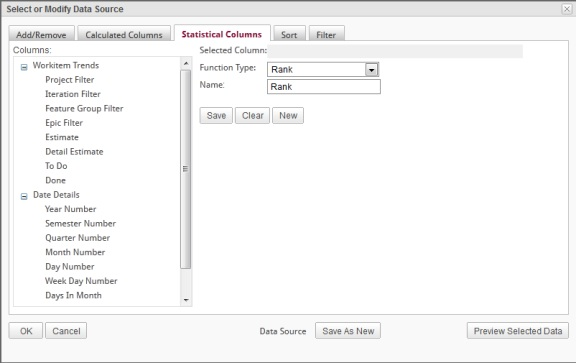
- Choose a Function Type from the dropdown
- Select a Column from the list (function applies to this column's values)
- (Optional) Modify the default Name
- Click OK to create the column
The statistical column becomes available for selection in the Report Builder.
Statistical columns not used in the report are automatically deleted when exiting the Report Builder.
Statistical Function Examples
Rank Example:
Ranks Agility drop-down values from lowest to highest (e.g., Low, Medium, High):
Reverse Rank Example:
Ranks from highest to lowest value:
Running Total Example:
Maintains cumulative total:
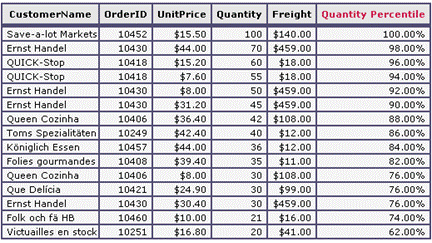
Percentile Example:
Classifies by percentage distribution:
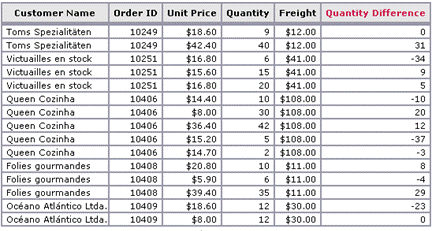
Difference from Previous Example:
Shows row-to-row changes:
Add Display Elements
Display elements present your data visually in the report.
Insert Tables and Crosstabs
Tables display data in rows and columns, while crosstabs summarize data across two dimensions.
To add a table:
- From the Insert tab, click Table or drag it to the Report Layout panel
- A new configuration tab appears for the table
- Configure table columns, grouping, and settings (see detailed table configuration below)
To add a crosstab:
- From the Insert tab, click Crosstab
- Configure row fields, column fields, and data cells
Insert Charts and Graphs
Visual charts help identify trends and patterns in your data.
Supported chart types:
- Bar charts (vertical and horizontal)
- Line charts
- Pie charts
- Area charts
- Scatter plots
- Tree maps
To add a chart:
- From the Insert tab, select a chart type
- Configure the chart data source
- Set X-axis and Y-axis fields
- Configure chart appearance and style
Add Labels and Images
Enhance reports with descriptive text and branding images.
To add labels:
- From the Insert tab, click Label
- Enter label text
- Configure font, size, color, and alignment
To add images:
- From the Insert tab, click Image
- Specify the image source:
- Upload from file
- Reference URL
- Use embedded image
- Set image size and alignment
Configure Tables
Tables are the most common display element in custom reports.
Configure Table Columns
Select which data columns appear in your table and how they display.
To configure columns:
- Select the table in the Report Layout panel
- In the Configuration panel, use the Tabular Columns tab
- Drag columns from the Data Source panel to the table configuration
- For each column, set:
- Label: Display name
- Width: Column width in pixels or percentage
- Alignment: Left, center, or right
- Format: Number format, date format, or custom format
Group Table Data
Grouping organizes rows into logical sections with optional subtotals.
To add grouping:
- In the table configuration, select the Grouping tab
- Drag a column to the grouping area
- Configure group settings:
- Group header: Text to display for the group
- Show subtotal: Calculate subtotals for numeric columns
- Page break: Start each group on a new page
Configure Crosstabs
Crosstabs summarize data across two dimensions with calculated intersections.
To configure a crosstab:
- Drag columns to Row Fields (vertical dimension)
- Drag columns to Column Fields (horizontal dimension)
- Drag numeric columns to Data Cells (values to summarize)
- Select aggregation function: Sum, Average, Count, Min, Max
Crosstab settings:
- Show row totals: Display total for each row
- Show column totals: Display total for each column
- Show grand total: Display overall total
- Suppress empty rows/columns: Hide rows or columns with no data
Format and Style Reports
Apply formatting to improve report readability and visual appeal.
Apply Report Headers
Report headers appear at the top of each page.
To add a header:
-
From the Insert tab, click Header
-
Enter header content:
- Static text
- Report title
- Company name or logo
- Page numbers
- Date/time tokens
-
Configure header appearance:
- Font and size
- Background color
- Border style
Configure Report Settings
Control overall report layout and behavior.
To configure report settings:
- From the Settings tab, click Report Settings
- Set options:
- Page size: Letter, Legal, A4, or custom
- Orientation: Portrait or landscape
- Margins: Top, bottom, left, right
- Columns: Multi-column layout
- Background: Background color or image
Apply Stylesheets
Stylesheets provide consistent formatting across multiple reports.
To select a stylesheet:
- From the Settings tab, choose a stylesheet from the dropdown
- Available styles:
- Default
- Classic
- Modern
- Professional
- Custom (if configured by administrator)
Preview and Save Reports
Test your report and save the definition for future use.
Preview the Report
To preview:
- Click the magnify icon in the toolbar
- Or click Preview from the File tab
The report renders with actual data from the Data Mart database.
Save Report Definitions
To save a report:
-
Click the
 save icon in the toolbar
 -
Or select Save or Save As from the File tab
-
Enter a report name
-
Choose a folder location:
- My Personal Reports: Private to your account
- Shared Reports: Available to other users (requires permissions)
-
(Optional) Add a description
-
Click Save
Save frequently to preserve your work and avoid session timeout data loss.
Next Steps
After building your custom report:
- Export the report - See Export Custom Reports
- Share with team members - See Manage Custom Reports
- Add to a dashboard - See Dashboards
- Query the Data Mart directly - See Data Mart Query Examples
Related Topics
- Data Source Objects - Complete reference of available data sources
- Dashboards - Build dashboards with multiple report panels
- Data Mart - Understand the Data Mart architecture
- Custom Reporting and Data Mart - Overview of custom reporting capabilities